

[PS1] Designing a sustainability flywheel for profit, resilience, and long-term value
Profitable Sustainability, article 1: Designing a sustainability flywheel for profit, resilience, and long-term value

From ESG noise to a compounding engine
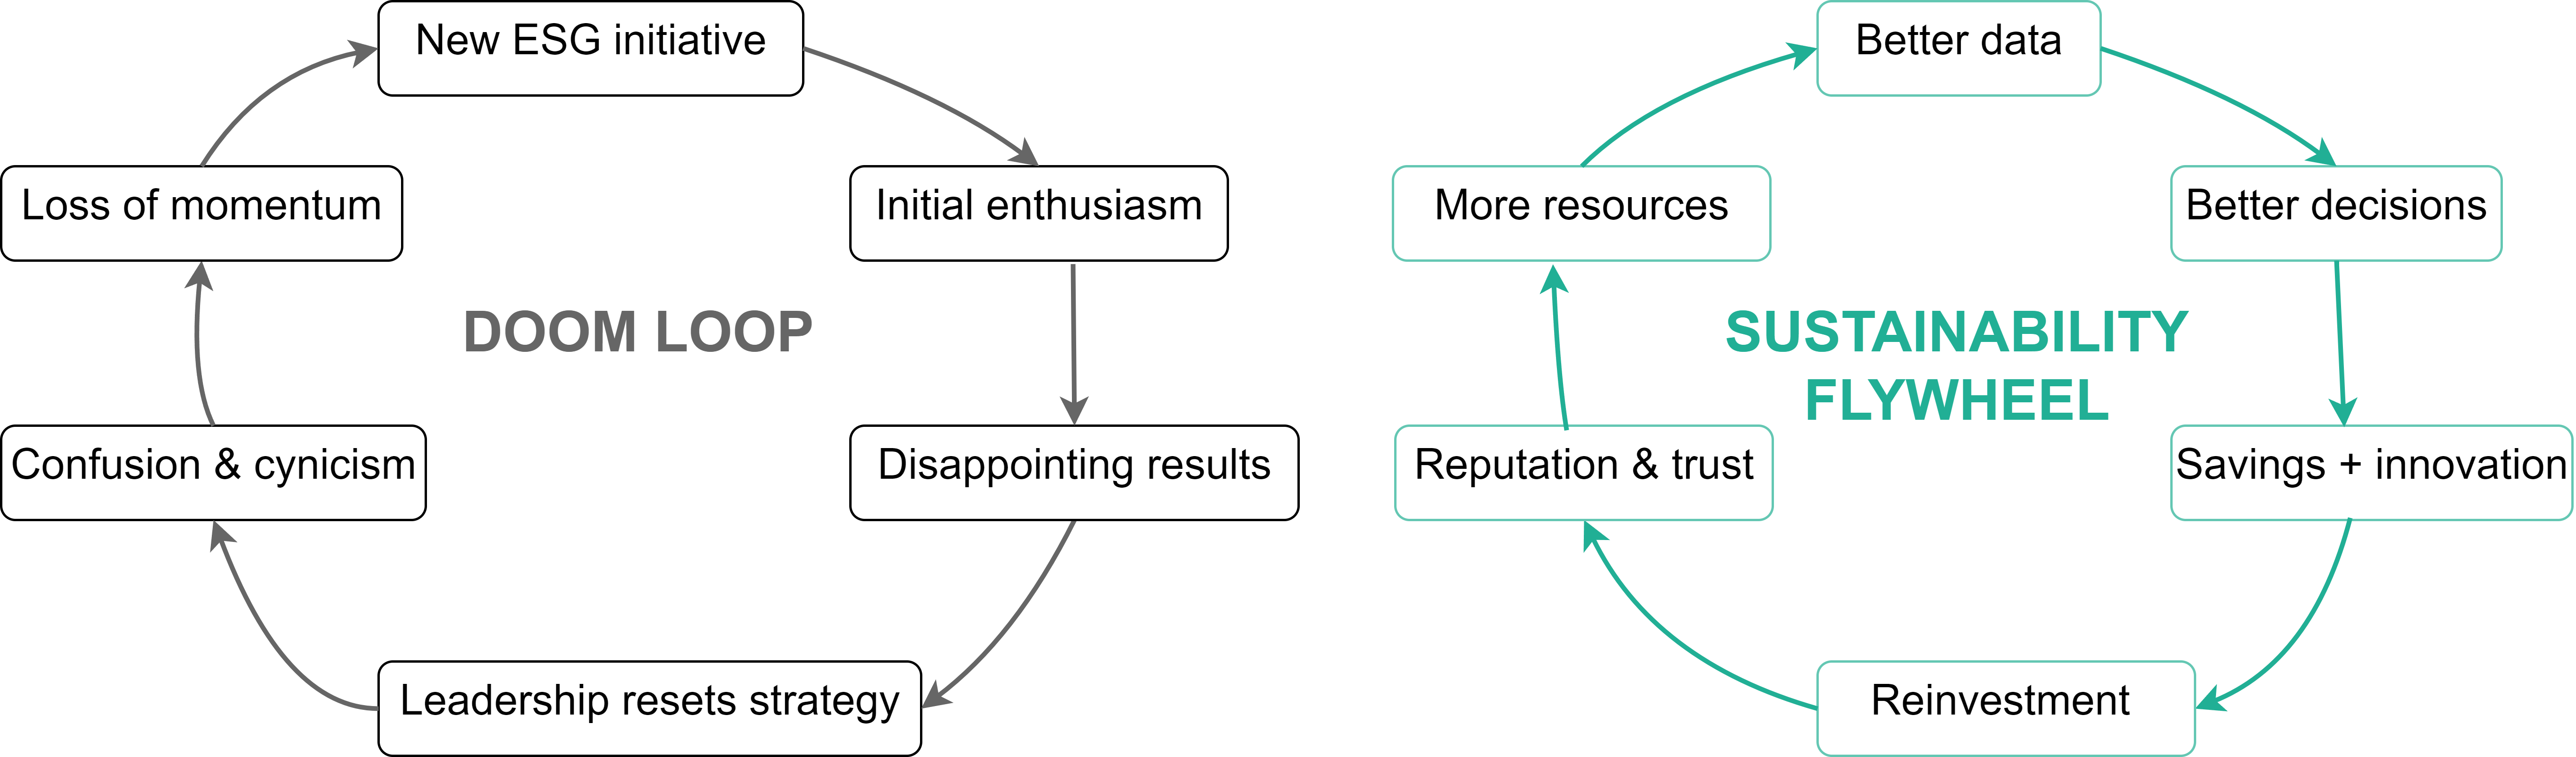
Many companies are stuck in what Jim Collins would call a “doom loop”: they launch a sustainability initiative, publish a report, change direction when results disappoint, and repeat. Momentum never builds, people get cynical, and sustainability gets labelled a cost or a distraction.
But it doesn’t have to be this way. When sustainability is treated as part of the business model, not just a reporting exercise, it can:
Cut costs
Reduce risk
Open new revenue streams
Attract better talent and cheaper capital
Research on “high sustainability” firms shows that companies that embed sustainability in their strategy and processes tend to outperform their peers over the long term, both on stock performance and on traditional financial metrics.1.
So the question becomes:
How do you turn sustainability from a reporting burden into a self-funding engine for the business?
Jim Collins’ flywheel idea provides a simple, powerful way to do that.
In this article, you’ll learn:
✅ How Collins’ flywheel idea translates into a sustainability engine instead of a compliance treadmill.
✅ The six stages of a universal sustainability flywheel
✅ How sustainability can generate cost savings, revenue growth, and cheaper capital.
✅ How to design a company-specific flywheel
✅ Real-world case study and common ESG doom-loop behaviours to avoid.
By the end, you’ll have a simple mental model to turn sustainability from a reporting burden into a self-funding engine of competitive advantage.
What Jim Collins’ flywheel means for sustainability
Collins’ original flywheel research found three things that matter for us:
No single defining action. Great companies didn’t transform through one initiative or charismatic announcement. They did the right things consistently, over years, until momentum made success look “sudden” from the outside.
Consistent direction. Every small push pointed the same way. Strategy, people, systems, and culture reinforced one another instead of pulling in different directions.
Avoiding the doom loop. Struggling companies reacted to poor results with new strategies, restructurings, and slogans – never long enough in one direction to build momentum.
A sustainability flywheel is just that logic applied to ESG:
You choose a coherent sequence of causes and effects.
You push the same sequence quarter after quarter.
You stop expecting a “big bang” and start looking for steady compounding.
A simple sustainability flywheel that works for any organisation
Here is a basic flywheel that almost any organisation can use:
Better data → Better decisions → Savings & innovation → Reinvestment → Reputation & trust → More resources → (back to) Better data
In plain language:
Better data
You see where your biggest costs, emissions, and risks really are.Better decisions
You use that data to make smarter investment and business decisions.Savings & innovation
Those decisions reduce waste and open up new products and services.Reinvestment
You reinvest part of the savings into more improvements.Reputation & trust
Customers, employees, and partners start to notice real progress.More resources
You attract cheaper capital, better talent, and stronger partners – which helps you get even better data and repeat the cycle.
This is a general flywheel: it fits almost any sector.
Later in the article, we’ll look at a specific flywheel from Signify’s “Light as a Service” model. After that, we’ll show how your organisation can design its own version.
For now, let’s walk through the six steps in more detail.
Step 1 – Better data: from reporting to x-ray vision
Companies still collect ESG data mainly to fill in reports. But the real power of data is to act as x-ray vision for the business, revealing where money and risk are concentrated.
Surveys suggest many companies still approach ESG data primarily as a reporting obligation and struggle with data quality and availability2. When firms invest in granular data – by site, product, and supplier – they routinely discover high-impact “hotspots” that were invisible in aggregated numbers3. Examples:
One factory that uses far more energy than others
One product category that drives most of your emissions
A handful of suppliers responsible for most social or environmental risk
Better data helps you:
Spot waste and inefficiency that don’t show up clearly in the P&L
See physical and transition risks (e.g. floods, carbon pricing) at the level of specific assets or suppliers
Set realistic targets and incentives based on facts, not guesses
Practical focus:
Start by asking for a one-page map of your top 10 sites or product lines showing: energy cost, emissions, and volume. If your team cannot produce this quickly, you’ve just diagnosed your first flywheel bottleneck.
KPIs to track:
Share of high-impact sites with reliable energy/emissions data
Share of key suppliers with basic ESG data
Step 2 – Better decisions: from projects to capital allocation
In Collins’ language, each push on the flywheel is a decision supremely well executed. For sustainability, that means ESG data must shape core financial decisions, not just side projects.
There is growing evidence that when sustainability factors enter investment choices, firms manage risk better and avoid stranded assets. For example, research on corporate sustainability finds that companies with stronger sustainability policies and processes outperform their peers over time4 – suggesting that their capital allocation is better aligned with long-term value.
You see this in practice when:
A utility cancels a new high-emission plant because carbon risk makes it uneconomic.
A manufacturer selects more efficient equipment even if upfront capex is higher, because lifetime cost and risk are lower.
A bank screens lending based on transition risk, avoiding future credit losses.
Practical focus:
Make sustainability non-optional in investment decisions. For all material capex and major product launches, require a short section on:
Impact on emissions/resources
Expected cost savings or revenue from ESG features
Risk exposure (e.g. regulation, carbon price, water stress)
KPIs to track:
% of capex proposals that include quantified ESG impacts
% of major decisions changed or cancelled based on ESG insights
Step 3 – Savings & innovation: the self-funding engine
Once sustainability factors are part of everyday decisions, you start to see financial benefits.
On the cost side, many resource-efficiency projects (energy, water, waste, logistics) show attractive returns, often with payback in a few years or less.
Examples from well-known companies:
3M’s long-running “Pollution Prevention Pays” programme has reportedly saved the company billions by redesigning products and processes to reduce waste5.
FedEx’s move to more efficient, hybrid, and electric vehicles has cut fuel use by tens of millions of gallons6.
On the revenue side, NYU Stern’s Sustainable Market Share Index shows that7:
Products marketed as “sustainable” often grow faster than conventional ones
They can often charge a price premium
They account for a disproportionate share of market growth in many consumer categories
In other words: resource efficiency + sustainable innovation =
Lower operating costs
More resilient, differentiated offerings
Stronger margins in growth categories
Practical focus:
Pick one domain where savings are likely and measurable (energy, logistics, packaging). Run two or three tightly scoped projects with clear baselines and tracking. Treat them explicitly as investment cases, not cost cuts.
KPIs to track:
Verified annual cost savings from sustainability projects (in currency)
Revenue and growth rate of products with defined sustainability benefits
Step 4 – Reinvestment: turning wins into compounding returns
In Collins’ flywheel, momentum builds when each turn makes the next turn easier. For sustainability, that happens when you reinvest part of the savings from Step 3 into the next wave of improvements.
Organisations formalise this through internal green funds or internal carbon prices. For example, green revolving funds in universities and companies finance efficiency projects and are repaid from the savings; those repayments then fund the next project, creating a snowball effect of improvements and cost reductions. Internal carbon fees are similarly often earmarked to pay for renewable energy or efficiency upgrades, closing the loop between performance and reinvestment.
Practical focus:
Make a simple rule:
“We will reinvest X% of verified sustainability savings into the next round of projects.”
Even if X is modest (e.g. 25–30%), it signals that sustainability is self-funding, not just another cost competing for budget.
KPIs to track:
% of verified savings reinvested into ESG/efficiency projects
Number and value of projects funded by prior-year savings
Step 5 – Reputation & trust: from story to financial asset
As the flywheel turns, results start to show up in brand, customer, and employee metrics.
Surveys show that:
Many consumers are willing to pay more for products they see as sustainable8
Employees (especially younger generations) are more likely to join and stay with employers whose values and sustainability performance match their own9
In B2B markets, ESG performance is increasingly part of supplier evaluation and selection10
Over time, these intangible effects translate into:
Higher customer lifetime value (loyalty and lower churn)
Lower recruitment and turnover costs
Better odds in tenders where sustainability is a requirement
Practical focus:
Measure and talk about specific sustainability outcomes that matter to customers and employees (e.g. product footprints, living-wage commitments, supplier upgrades), not just generic slogans.
KPIs to track:
% of customers citing sustainability as a reason for choosing your product (survey)
Employee engagement / retention where sustainability is mentioned as a factor
External ESG ratings or inclusion in sustainability indices
Step 6 – More resources: cheaper capital, better talent, stronger partnerships
In Collins’ terms, once the flywheel is moving, its own weight works for you. In sustainability, strong performance starts to attract capital, talent, and partners – giving you more force to push the next turn.
On capital, a 2024 MSCI study of global issuers finds a significant historical correlation between higher ESG ratings and a lower cost of capital, in both equity and debt markets. Companies with top ESG scores tend to have lower betas and tighter credit spreads than low-ESG peers, all else equal11.
Combine that with the hiring advantages mentioned above, and you get a reinforcing resource effect:
Investors more willing to fund your transition at attractive rates.
Top candidates more interested in working for you.
Customers and partners more willing to co-invest or sign long-term contracts.
Practical focus:
Track your cost of capital vs sector peers and explore whether stronger ESG performance could narrow the gap.
Use sustainability-linked loans or green bonds where appropriate to lock in lower spreads in exchange for clear ESG targets.
KPIs to track:
Cost of equity and debt relative to comparable peers
Volume of green or sustainability-linked financing
% of new hires citing sustainability as a reason to join (survey)
Case study: Circular “product-as-a-service” flywheel (Philips / Signify – light as a service)
Signify (formerly part of Philips) offers Light as a Service (LaaS).
Instead of selling lighting fixtures as products, they sell light as a service:
Signify owns the equipment
They design, install, and maintain it
The customer pays a recurring fee for light performance, not for lamps and fittings
This model supports both profitability and sustainability. Here’s the underlying flywheel, simplified.
1. Design for durability, efficiency, and easy repair
Signify’s circular lighting solutions are:
Modular (easy to upgrade and repair)
Efficient (low energy use)
Built to last
This reduces waste and extends product life.
2. Lower operational burden for the customer
Because Signify owns and maintains the equipment:
The customer avoids upfront capital investment
Maintenance and performance are Signify’s problem
Energy use – and energy bills – are lower
3. Recurring revenue and rich performance data
Signify gets:
Recurring income from long-term service contracts
Data on how systems perform over time
This data helps optimise performance, plan maintenance, and design better products.
4. Return and recapture of materials
At the end of the contract:
The fixtures still belong to Signify
Components can be reused, refurbished, or recycled
This is a key part of their circular economy strategy.
5. Reduced dependence on virgin materials & stronger value proposition
By recovering materials:
Signify needs fewer new raw materials
The offering becomes more attractive to customers that care about circularity and sustainability
6. Reinvestment in smarter systems
The combination of:
Data
Recurring revenue
Reused materials
allows Signify to invest in even better designs and services, which strengthens the next cycle.
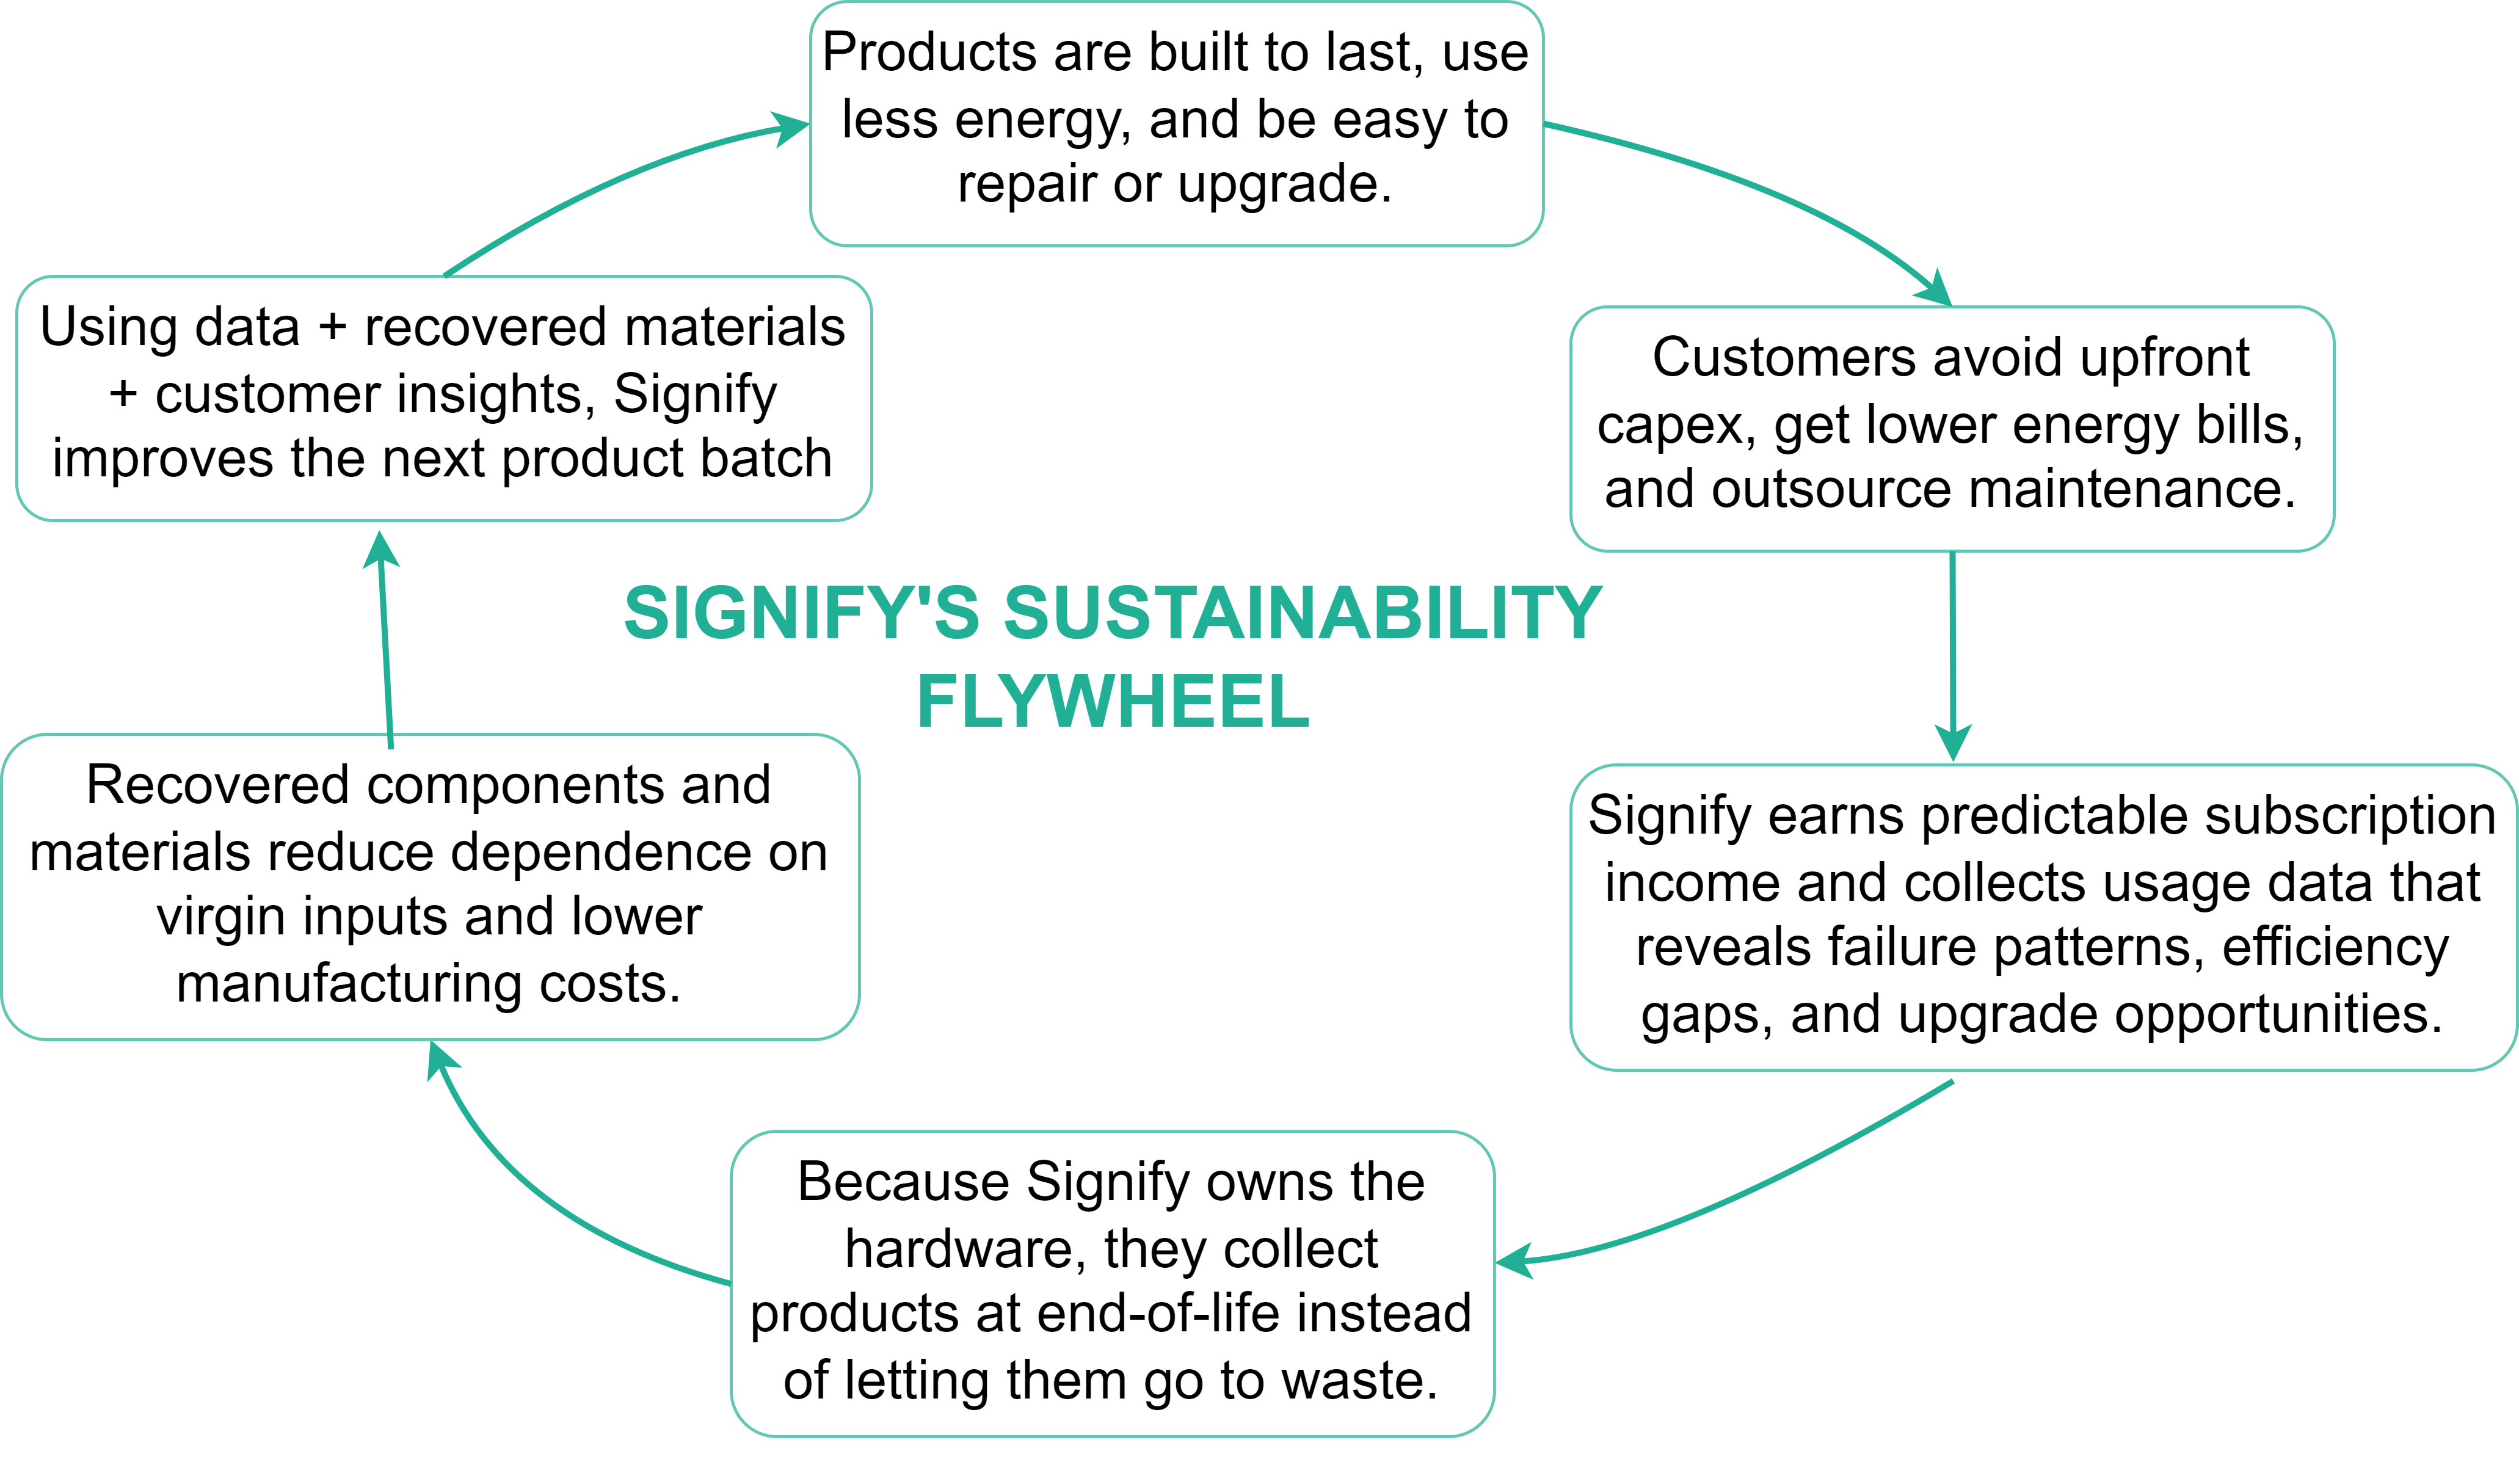
This is a concrete example of a company-specific flywheel built on circularity, service models, and data.
This flywheel is general. How do you find your specific flywheel?
The flywheel above is a universal template. It works in almost any organisation because every company needs:
Data
Decisions
Savings and innovation
Reinvestment
Reputation and trust
Resources
But the strongest flywheels build on what makes your organisation different.
To find your specific sustainability flywheel, ask:
Where do we spend the most money or use the most resources?
(e.g. energy, materials, logistics, buildings)Where are we under the most pressure from customers, regulators, or investors?
(e.g. emissions, packaging, human rights in the supply chain)Where do we already have strengths or capabilities?
(e.g. engineering, data, service models, circular design)
Your specific flywheel sits at the intersection of:
Biggest impact + Biggest pressure + Strongest capabilities
The next section shows how a global lighting company did exactly that.
Doom-loop patterns to avoid
Collins’ doom loop is painfully common in ESG: disappointing results → new programme → no momentum → disappointment → another reset. Research and practice highlight a few warning signs:
Leadership churn and fashion-driven ESG. New leaders bring new themes every two years; nothing lasts long enough to build momentum.
Score-chasing instead of substance. Time and money go into maximising ESG ratings rather than improving actual performance.
No ownership outside the sustainability team. The Chief Sustainability Officer and their team “own” everything; line managers see ESG as someone else’s job.
No measurement of financial impact. If savings and growth from sustainability are not measured, finance will treat ESG as a cost centre and cut it when budgets tighten.
The remedy is to design the flywheel explicitly and align roles, incentives, and metrics around it – then keep pushing.
Takeaway
Jim Collins wrote that there is “no miracle moment” in a good-to-great transformation – just a flywheel that slowly, then suddenly, builds unstoppable momentum.
A sustainability flywheel applies that same logic to ESG:
Better data gives you x-ray vision of costs and risks.
Better decisions bring sustainability into capital allocation.
Savings & innovation make the engine self-funding.
Reinvestment turns one-off wins into compounding gains.
Reputation & trust lift revenue, loyalty, and retention.
More resources – cheaper capital, better talent, stronger partners – feed back into the next loop.
The research base suggests that companies who build this kind of integrated, long-term sustainability model tend to outperform their peers financially and manage risk more effectively.
If you do only three things after reading this:
Decide where your first flywheel lives (one domain, not everything at once).
Define a handful of KPIs that make each step of the loop visible.
Commit to reinvesting part of the gains and tracking the financial impact.
Do that consistently, and you move sustainability out of the doom loop of one-off initiatives – and into the quiet, compounding discipline that Collins found behind every great company.
Next article in this series:
![[PS2] How to build an innovation engine that feeds your sustainability flywheel](https://substackcdn.com/image/fetch/$s_!4ELR!,w_140,h_140,c_fill,f_webp,q_auto:good,fl_progressive:steep,g_auto/https%3A%2F%2Fsubstack-post-media.s3.amazonaws.com%2Fpublic%2Fimages%2F0b8329e3-fd8b-4c11-a6bb-aa630b25ede6_1024x1024.png)
Relevant Sources
Good to Great: Why Some Companies Make the Leap... and Others Don’t
Sustainability innovations and firm competitiveness: A review - ScienceDirect
Product sustainability: Back to the drawing board | McKinsey
Achieving sustainable profitable growth with ESG | McKinsey
Sustainable Investing Funds Beating Traditional Funds in 2025 | Morgan Stanley
Creating value for customers with Signify Lighting Services | Signify Company Website