

[INSIGHT] E1: How to calculate your company's energy use? (PART 1)
ESRS E1: How to calculate your company's energy use? Including bottom-up energy usage estimation without sensors

1. Introduction
Energy is the heartbeat of every company’s operations — from lighting offices to powering production lines and heating facilities. Yet many businesses still struggle to quantify their true energy consumption. Without this understanding, strategies for efficiency, emissions reduction, or cost control remain guesswork.
At its core, calculating energy usage means translating what happens in day-to-day operations — machines running, heating cycles, fuel burned — into measurable data.
Under frameworks such as the Corporate Sustainability Reporting Directive (CSRD) and ISO 50001, companies are expected to monitor, measure, and disclose energy consumption systematically. The GHG Protocol also requires accurate energy data as the basis for Scope 1 (direct fuel use) and Scope 2 (purchased energy) emissions.
In this article, we’ll explore practical ways to measure energy use, whether or not you have sensors installed. You’ll learn:
✅ How to calculate electricity, gas, heat, and fuel consumption from equipment data (bottom-up approach)
✅ How sensors and smart meters improve accuracy and insight
✅ What other methods — like utility bills, modeling, or benchmarking — can complement calculations
✅ Which tools and templates make energy tracking manageable
✅ How different industries can tailor their approach for meaningful results
By the end, you’ll have a practical playbook to quantify total energy use across all carriers and sites, using methods aligned with your data reality and maturity level.

2. Bottom-up energy estimation: calculating from the ground up
The bottom-up approach starts with what you can see: the equipment, systems, and devices that consume energy. Instead of relying on utility data, you build your total energy picture from individual loads, summing their estimated use.
This approach is indispensable when sensors are absent — for example, during an energy audit or initial CSRD data inventory.
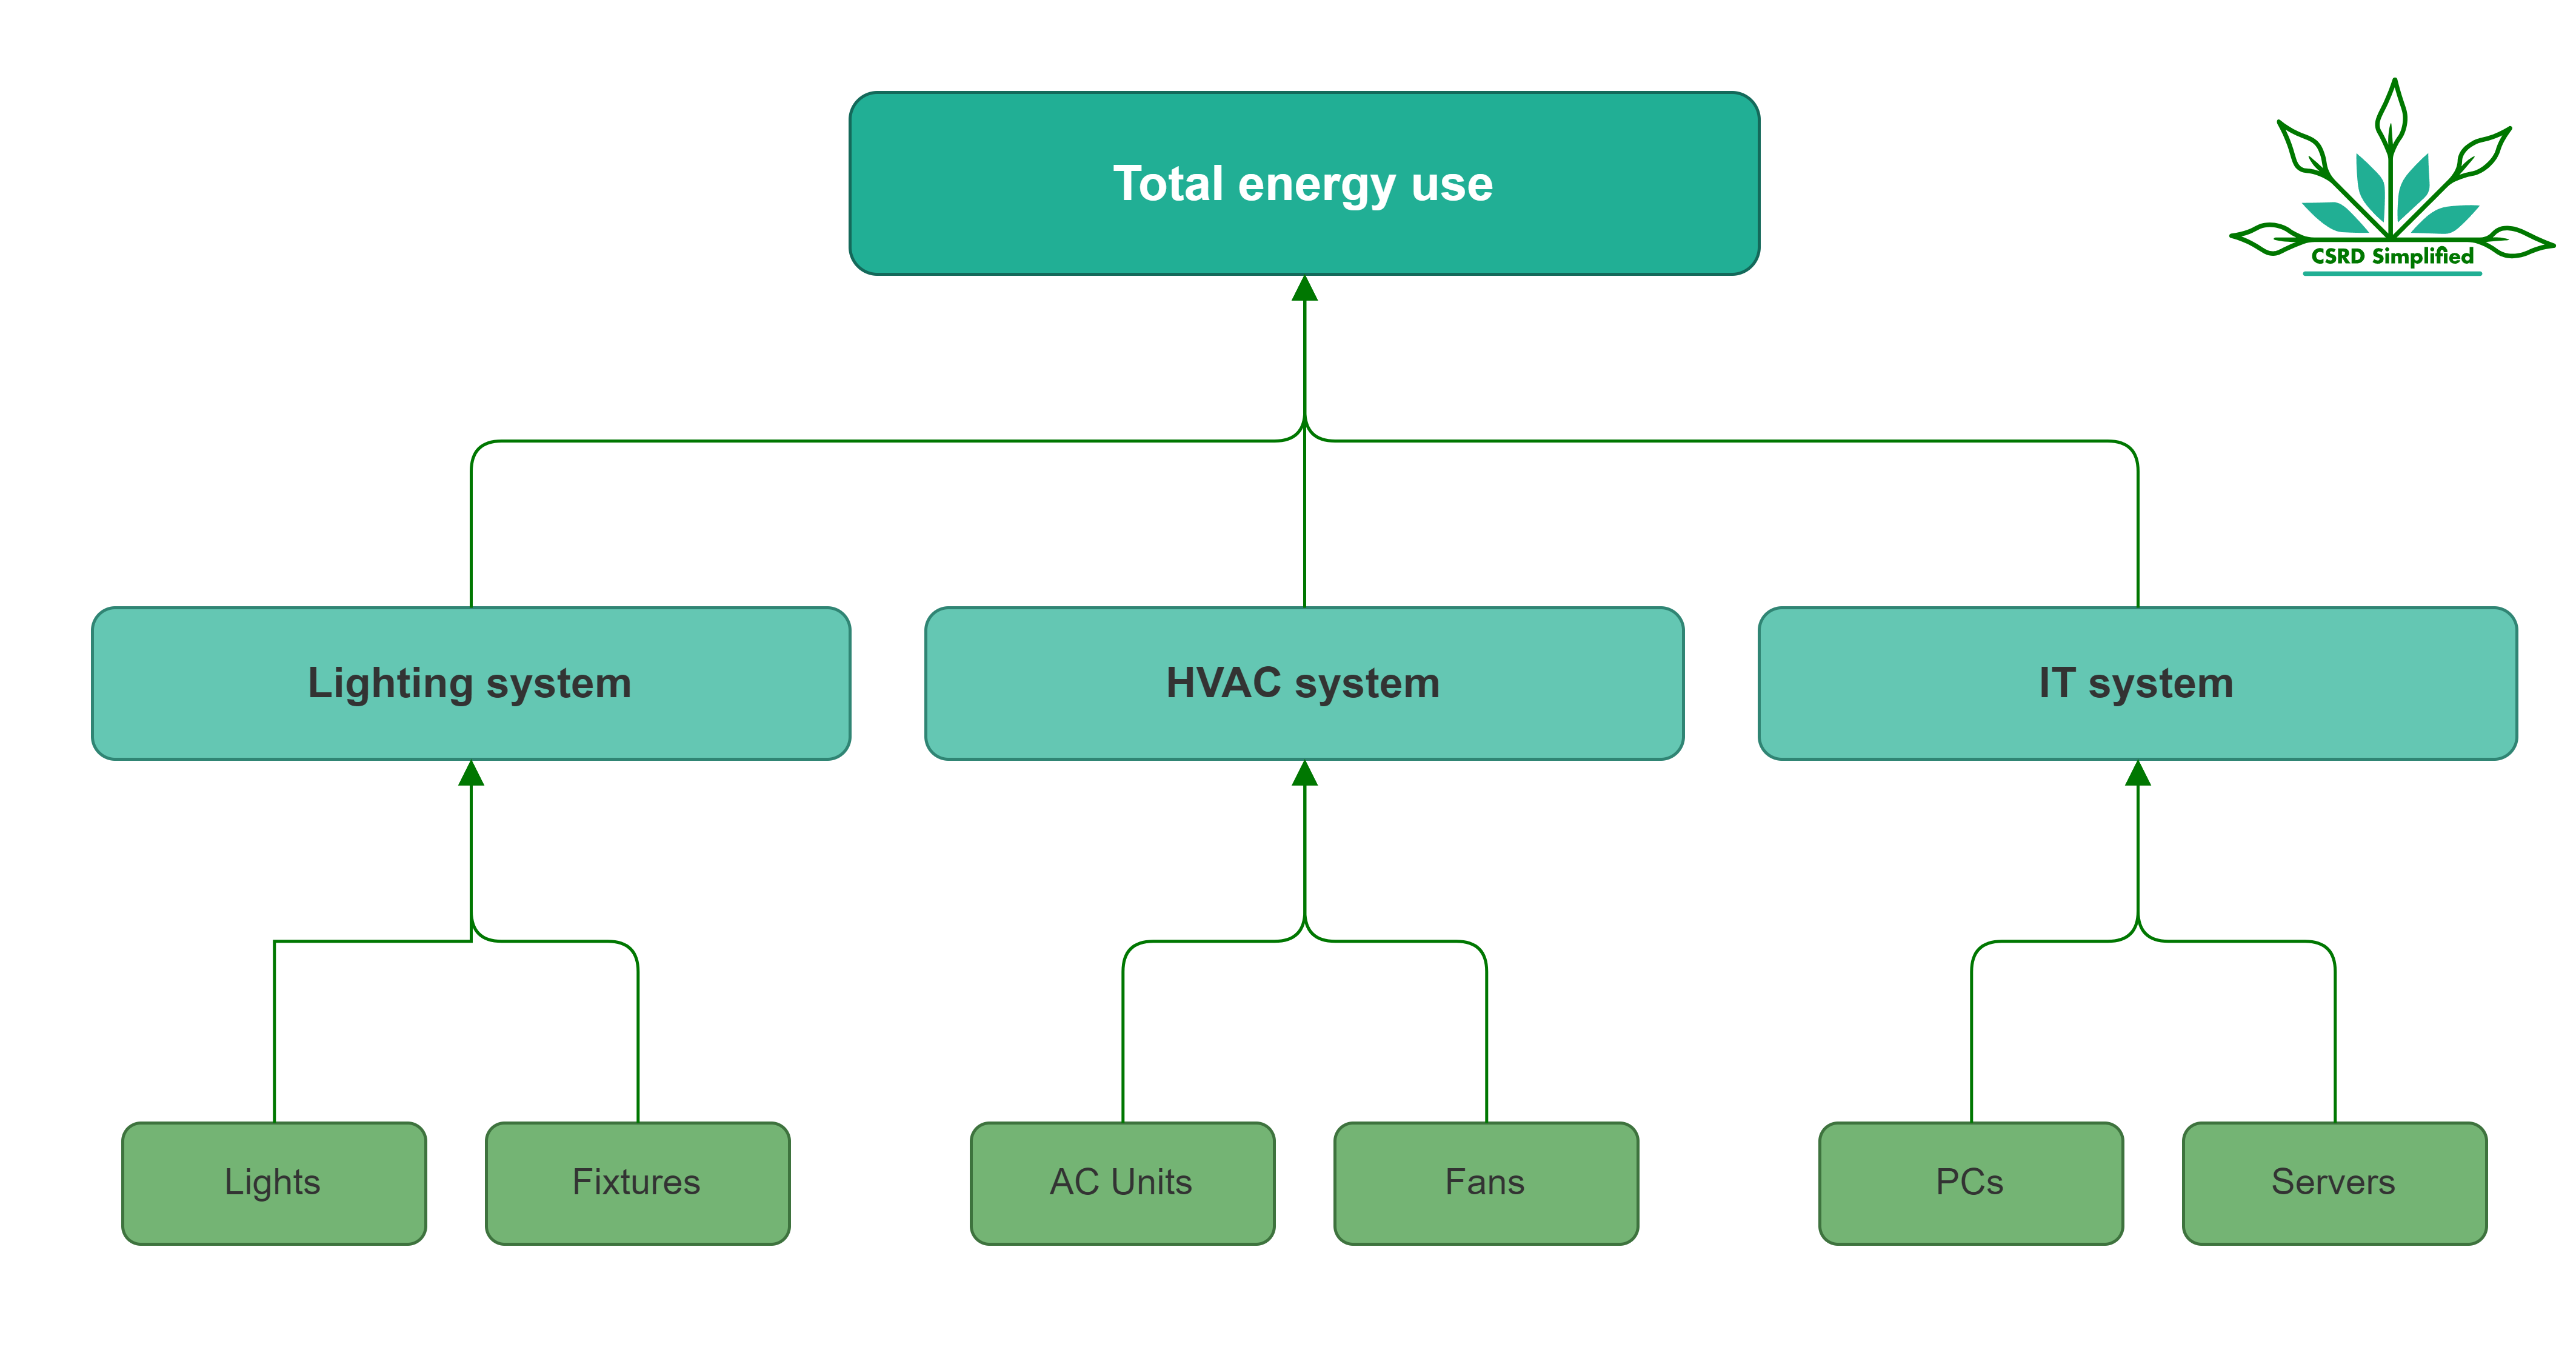
Step 1 – Create an inventory of energy-consuming equipment
Make an overview of all the systems that consume energy, such as lighting, climate control, IT, and so on.
For each system, list every energy consumer, such as machines, lights, motors, PCs, AC units, and so on. For each, record its:
Power rating or fuel input (from nameplates or manuals)
Energy source (electricity, gas, fuel)
Typical operating hours per day or per year
Usage (how much of the rated power it actually uses on average)
![[INSIGHT] E1: Guide to calculating rated power from nameplates & documentation (PART 2)](https://substackcdn.com/image/fetch/$s_!rTGI!,w_140,h_140,c_fill,f_webp,q_auto:good,fl_progressive:steep,g_auto/https%3A%2F%2Fsubstack-post-media.s3.amazonaws.com%2Fpublic%2Fimages%2F20657086-78d5-4c2d-948b-8af47f39625e_2048x2048.jpeg)
Step 2 – Apply standard formulas
Once the data are collected, the calculations are straightforward:
Power (kW) → how strong the machine or device is (its maximum rating).
Usage (%) → how hard it’s actually working (for example, 70% of full power).
Time (h) → how long it runs.
100 = 100,000 → converts percent (usage) to a fraction.
Example electricity
This shows a 200 W (200 W = 0.2 kW) fridge running at 85% of full power for 6 hours per day → uses ≈ 1.02 kWh of energy in a day.
\(\text{Energy (kWh)} = \frac{0.2 \times 85 \times 6}{100} = 1.02 \, \text{kWh}\)Example natural gas
Consider a 6.7 kW gas heater used for 5 hours per day over 150 days per year.
\(\text{Energy (kWh)} = \text{Power (kW)} \times \text{Hours used per day} \times \text{Days used per year}\)\(\text{Energy (kWh)} = 6.7 \times (5 \times 150) = 6.7 \times 750 = 5025 \, \text{kWh/year}\)In case you want to convert the kWh to cubic meter: natural gas contains roughly 10 kWh of energy per m³, so you can divide the kWh by 10.
\({\text{Gas usage}} = \frac{5025}{10} = 503 \, \text{m}^3/\text{year}\)
For liquid fuels: Use the total volume of fuel consumed (i.e. in liters). If this information is not available, estimate it by multiplying the average fuel consumption rate (i.e. liters per hour) by the total operating hours.
For thermal energy (steam or heat): Use the total amount of heat energy supplied (in kWh, MJ, or kg of steam). If this is not directly known, estimate it by multiplying the average thermal power output (i.e. kW) by the total operating hours.
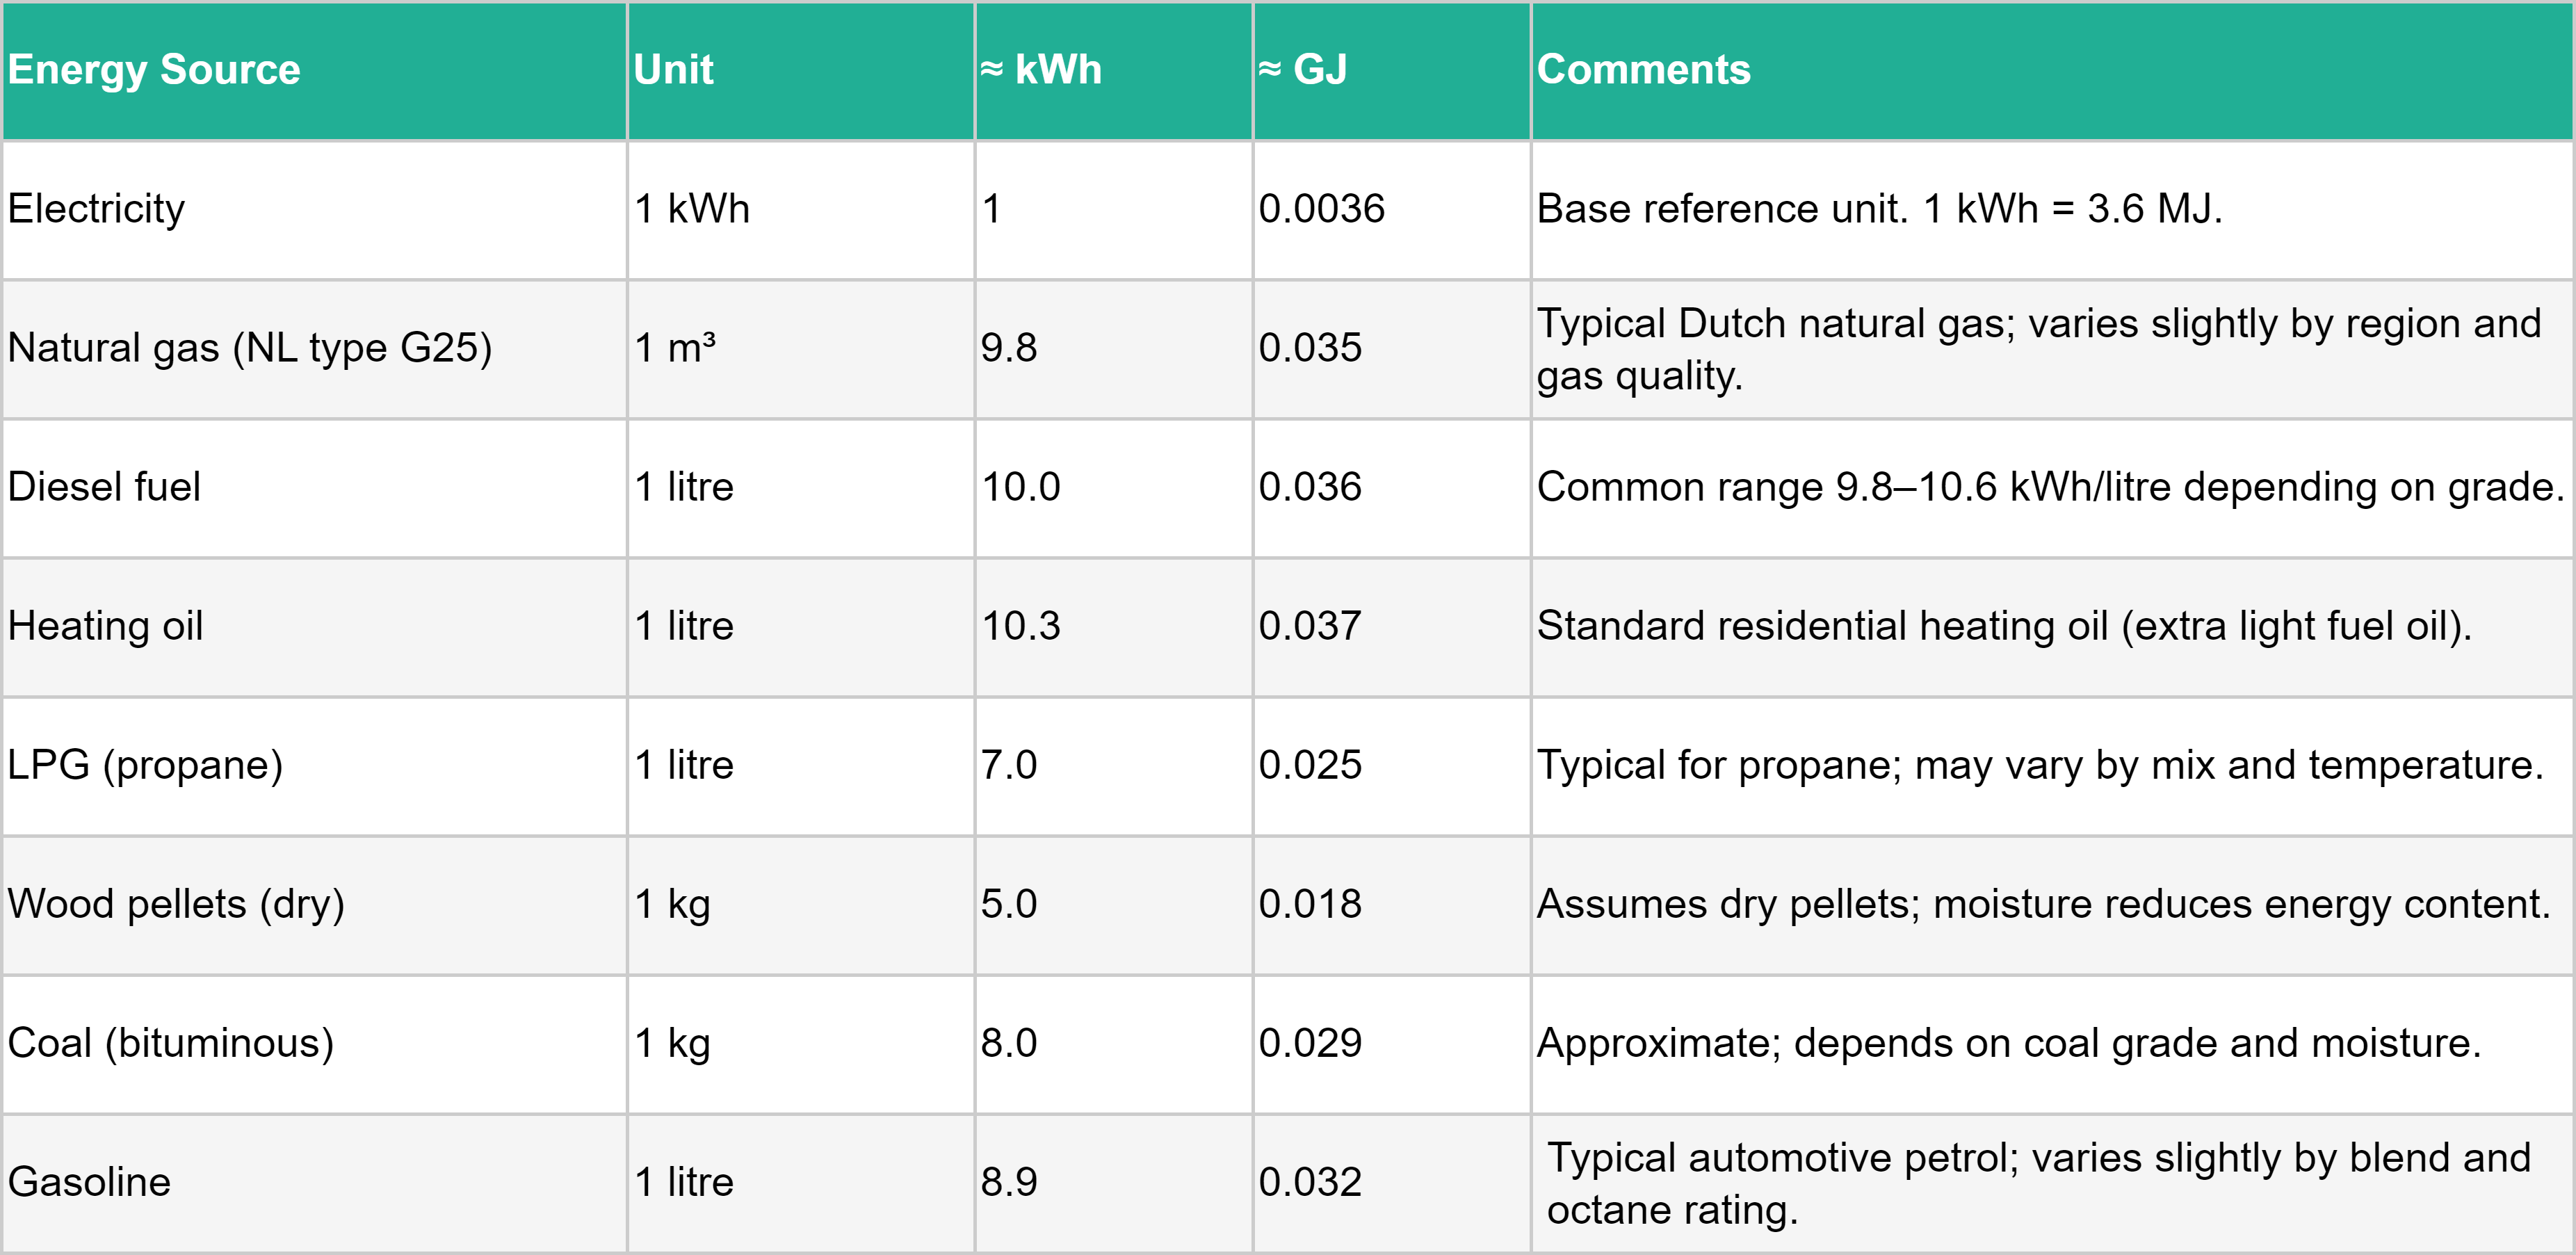
Step 3 – Convert to a common unit
Energy can be measured in many different units depending on the source — such as kilowatt-hours (kWh) for electricity, litres for fuel, cubic metres for gas, or megajoules (MJ) for heat.
To compare total energy consumption or calculate overall efficiency, all energy types should be converted into a common unit such as kWh or GJ (gigajoules).
When to Use kWh
Common in buildings, utilities, and energy bills.
Matches how electricity use and costs are typically recorded.
Easy to relate to emissions and costs.
1 GJ = 277.78 kWh
When to Use GJ
Preferred in scientific, industrial, or engineering contexts.
Compatible with the SI (International System) of units.
Useful when dealing with large-scale or thermal energy (e.g., steam, fuel, process heat).
1 kWh = 0.00360 GJ
Step 4 – Validate and cross-check
The bottom-up total should be compared with monthly utility bills. A deviation within ±10 % suggests reasonable accuracy; large gaps indicate that operating hours or usage need refining.
Advantages and limitations
Advantages
Works without sensors or digital infrastructure.
Reveals where energy is actually used, equipment by equipment.
Enables quick identification of “hot spots” for savings.
Limitations
Relies on estimates and manual data gathering.
Risk of missing hidden or intermittent loads.
Time-consuming for large facilities.
3. Measurement through sensors and smart meters
Once companies install smart meters or submeters, energy data becomes continuous, accurate, and location-specific. Sensors replace assumptions with real measurements, capturing how much electricity, gas, or heat each process uses in real time.
Types of meters and sensors
Metering systems can be divided into:
Main utility meters: provided by energy suppliers, measuring total facility consumption for billing.
Submeters: installed on specific areas or machines to separate usage (e.g., lighting circuits, HVAC systems, compressors).
Smart meters: digital, often with two-way communication, logging data at 15-minute or hourly intervals.
IoT sensors: clamp-on current sensors, smart plugs, flow or temperature sensors that transmit data wirelessly to energy management platforms.
In advanced setups, these feed into an Energy Management System (EMS) or Building Management System (BMS) that aggregates and visualizes usage.
Data collection and integration
Collected data flows to a central dashboard or cloud platform, for example through Wi-Fi, LoRaWAN, or wired networks. Each meter provides time-stamped readings of kWh, kW demand, or gas flow.
Key features include:
Real-time dashboards for electricity, gas, and heat consumption
Trend analysis over days, weeks, or months
Automated alerts when usage spikes or deviates from expected patterns
Reporting functions for CSRD, ISO 50001, or internal KPIs
Advanced EMS platforms can integrate multiple data sources — meters, PLCs, or even production data — to calculate metrics such as energy per unit of product or energy cost per site.
Advantages
High accuracy and time resolution (often 5- to 15-minute intervals)
Enables load profiling to identify peak demand times
Supports measurement and verification of savings projects
Allows automated alerts and optimization (e.g., shutting off idle equipment)
Enhances employee engagement through transparent dashboards
Limitations
Higher upfront cost for meters, software, and installation
Requires IT integration and data management
May produce overwhelming data volumes without proper analytics
Needs calibration and maintenance to stay accurate
Still, once deployed, smart metering systems transform energy management from reactive to proactive, turning consumption data into operational intelligence.
Learn more about IoT here
4. Complementary methods for a complete energy picture
Even with calculations and meters, other data sources can refine accuracy and strategic insight.
Utility bill analysis
Utility bills remain the most accessible data set for many companies. Analyzing them can reveal consumption trends, cost structures, and anomalies.
Key indicators include:
Energy Use Intensity (EUI): total energy use per floor area (kWh/m²) or per unit of output.
Load factor: total kWh ÷ (peak kW × hours), showing how evenly electricity is used.
Weather normalization: adjusting consumption for heating and cooling degree-days to separate weather effects from operational changes.
Tariff breakdown: identifying high demand or power-factor charges that could be reduced.
Cross-checking internal (bottom-up) calculations with billed totals helps validate estimates. Plotting at least twelve months of billing data can immediately reveal seasonal variations or abnormal spikes in use or cost.
Energy modeling and digital twins
When data is scarce or forward-looking scenarios are needed, energy modeling and digital twins can simulate consumption.
A Building Energy Model (BEM) represents geometry, materials, HVAC systems, and occupancy to calculate theoretical energy needs. These models can be calibrated with actual bills to increase accuracy.
A digital twin goes further: a dynamic model that receives live sensor data and predicts performance. In factories or large campuses, twins can test “what-if” scenarios — for instance, simulating a 2 °C reduction in heating setpoints to estimate fuel savings.
Such modeling supports long-term planning and investment decisions (e.g., sizing renewables or retrofits) and complements real-time monitoring.
Benchmarking tools
Benchmarking helps companies understand how their energy performance compares to peers or best-practice standards.
The ENERGY STAR Portfolio Manager (U.S.) calculates normalized scores (1–100) for many building types, adjusting for climate and operating hours. A score ≥ 75 indicates top-quartile efficiency.
The CIBSE TM46 benchmarks (U.K.) provide typical kWh/m² per year by building type — for example, general offices or hospitals — and guide target setting.
Load disaggregation (NILM)
Non-Intrusive Load Monitoring (NILM) uses algorithms to infer which devices are operating from aggregate meter data. NILM can separate major electrical loads (lighting, HVAC, motors) without physical submeters.
While accuracy varies, NILM offers a cost-effective way to identify key consumers and behavioral savings opportunities, especially in offices or small sites.
5. Choosing the right approach for your organization
No single method fits all companies. The optimal mix depends on energy intensity, data maturity, and budget.
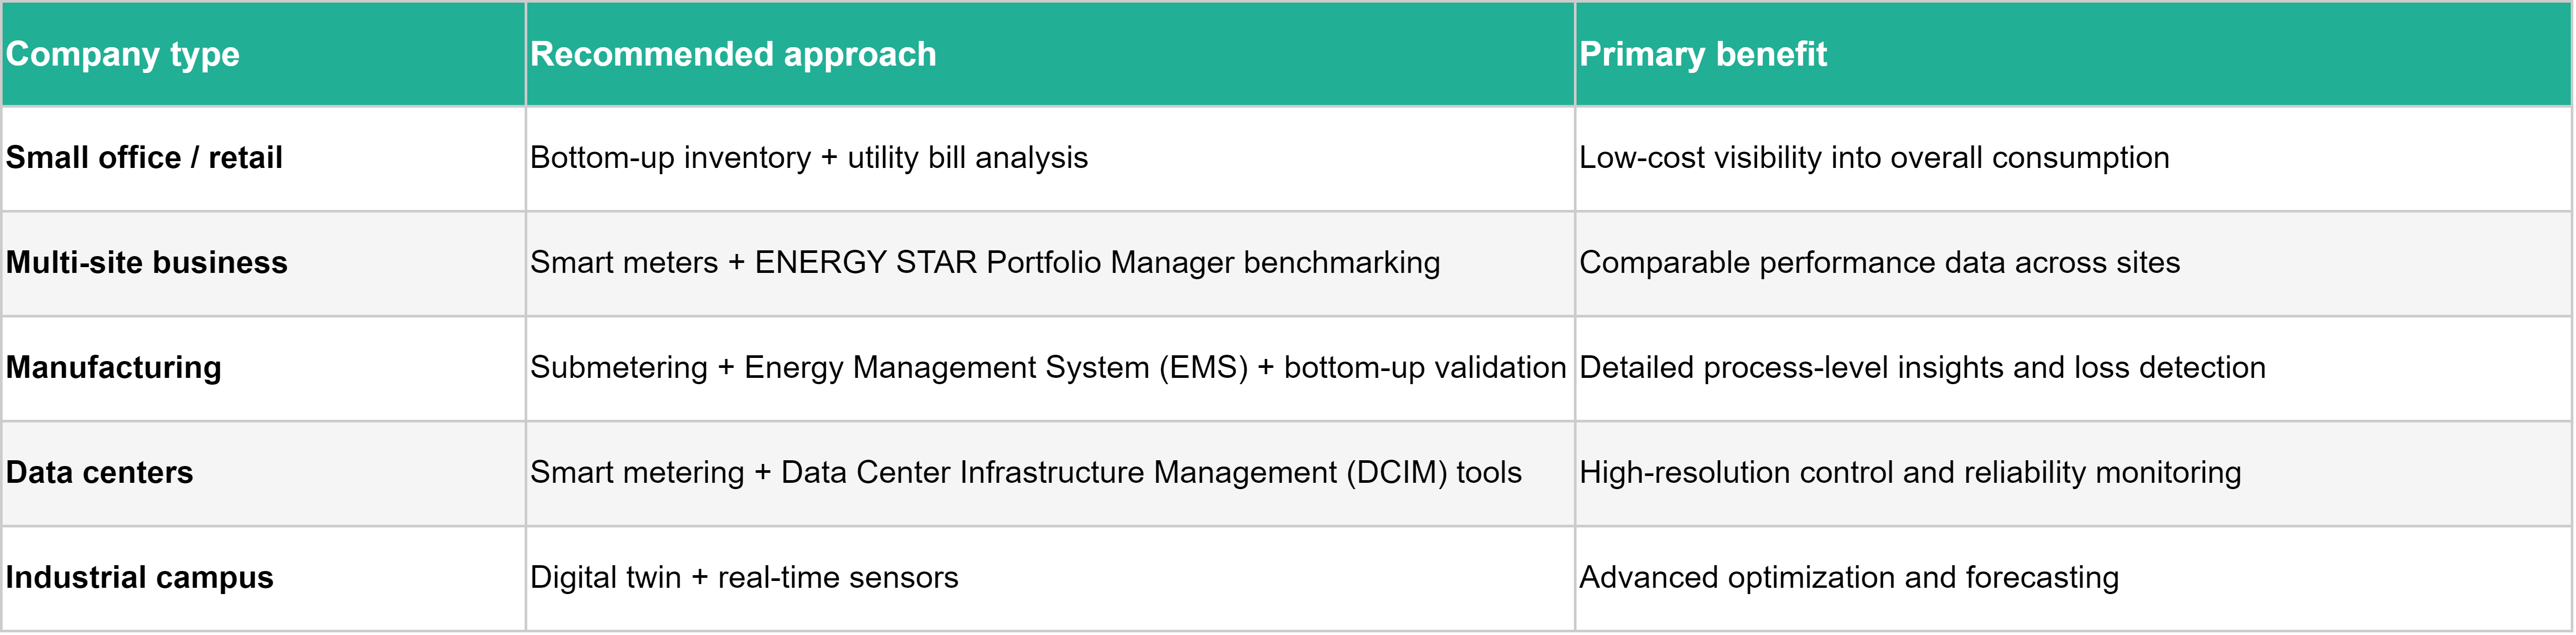
A hybrid strategy usually works best: start with a manual inventory, validate with utility bills, then expand to sensors where the biggest loads or uncertainties lie.
6. Key takeaways for corporate professionals
Start simple, refine over time. A well-structured equipment inventory can yield credible first-year energy data even before sensors are installed.
Validate across sources. Always cross-check manual calculations against utility bills and meter data for consistency.
Invest in data systems strategically. Focus metering on high-consumption areas first; expand once ROI is proven.
Use energy data as a management tool. The goal is not just reporting — it’s discovering inefficiencies and reducing cost and carbon emissions.
Normalize and benchmark. Adjust for climate, operating hours, and production to make comparisons meaningful.
Integrate into sustainability reporting. Reliable energy data directly supports CSRD disclosures, ISO 50001 audits, and GHG Scope 1–2 inventories.
Relevant Sources
Prices of natural gas and electricity | CBS
Comparing running costs of diesel, LPG and electrical pumpsets
Higher Calorific Values of Common Fuels: Reference & Data
Energy savings measurement guide
An energy efficiency indicator based on the actual energy use of a building