


1. Why circularity is more than recycling
Most corporate circularity claims are based on recycling rates. A company announces that its packaging contains 30% recycled content, or that its factory diverts 90% of scrap from landfills.
Waste diversion is important. But treating recycling as the primary goal of circularity is a mistake.
Recycling is a last resort. When you recycle a steel beam, an aluminum casing, or a circuit board, you destroy the component shape, the embedded labor, and energy that created it. Melting or shredding the item back into raw materials demands substantial amounts of energy.
To lay the operational foundation for circular products, companies need two complementary tools: a system map that separates distinct material cycles, and a decision ladder that tells product teams which choice to prioritize first.
In this article, you will learn:
✅ The architecture of the systems map (Butterfly Model) and why biological and technical material cycles must be kept strictly separate.
✅ The logic of the 10R decision ladder and how it ranks circular actions from product refusal (R0) to energy recovery (R9).
✅ How the two frameworks connect by mapping the 10R decision ladder directly onto the inner and outer loops of the systems map.
✅ Three practical rules of thumb to prioritize tight loops over late-stage recycling.

2. Technical and biological cycles in the systems map
To move beyond recycling, you need a map of how materials circulate through an industrial economy. The Ellen MacArthur Foundation (EMF) designed the foundational model for this, building on the Cradle to Cradle principles of Michael Braungart and William McDonough. Most practitioners call this the Butterfly Diagram.
All physical flows split into two distinct cycles (often described in circular engineering as metabolisms):
Technical cycle: Finite industrial materials like steel, aluminum, and engineered polymers. Nature cannot absorb them. Discarded in the wild, they leach toxins or persist for centuries. Technical hardware must circulate indefinitely through maintenance, reuse, refurbishment, and mechanical recycling.
Biological cycle: Renewable organic nutrients like agricultural biomass, crops, and timber. Living systems break them down safely. Value is preserved through sequential product reuse (such as solid timber into paper), biogas fermentation, and controlled composting that returns nutrients back to the soil.
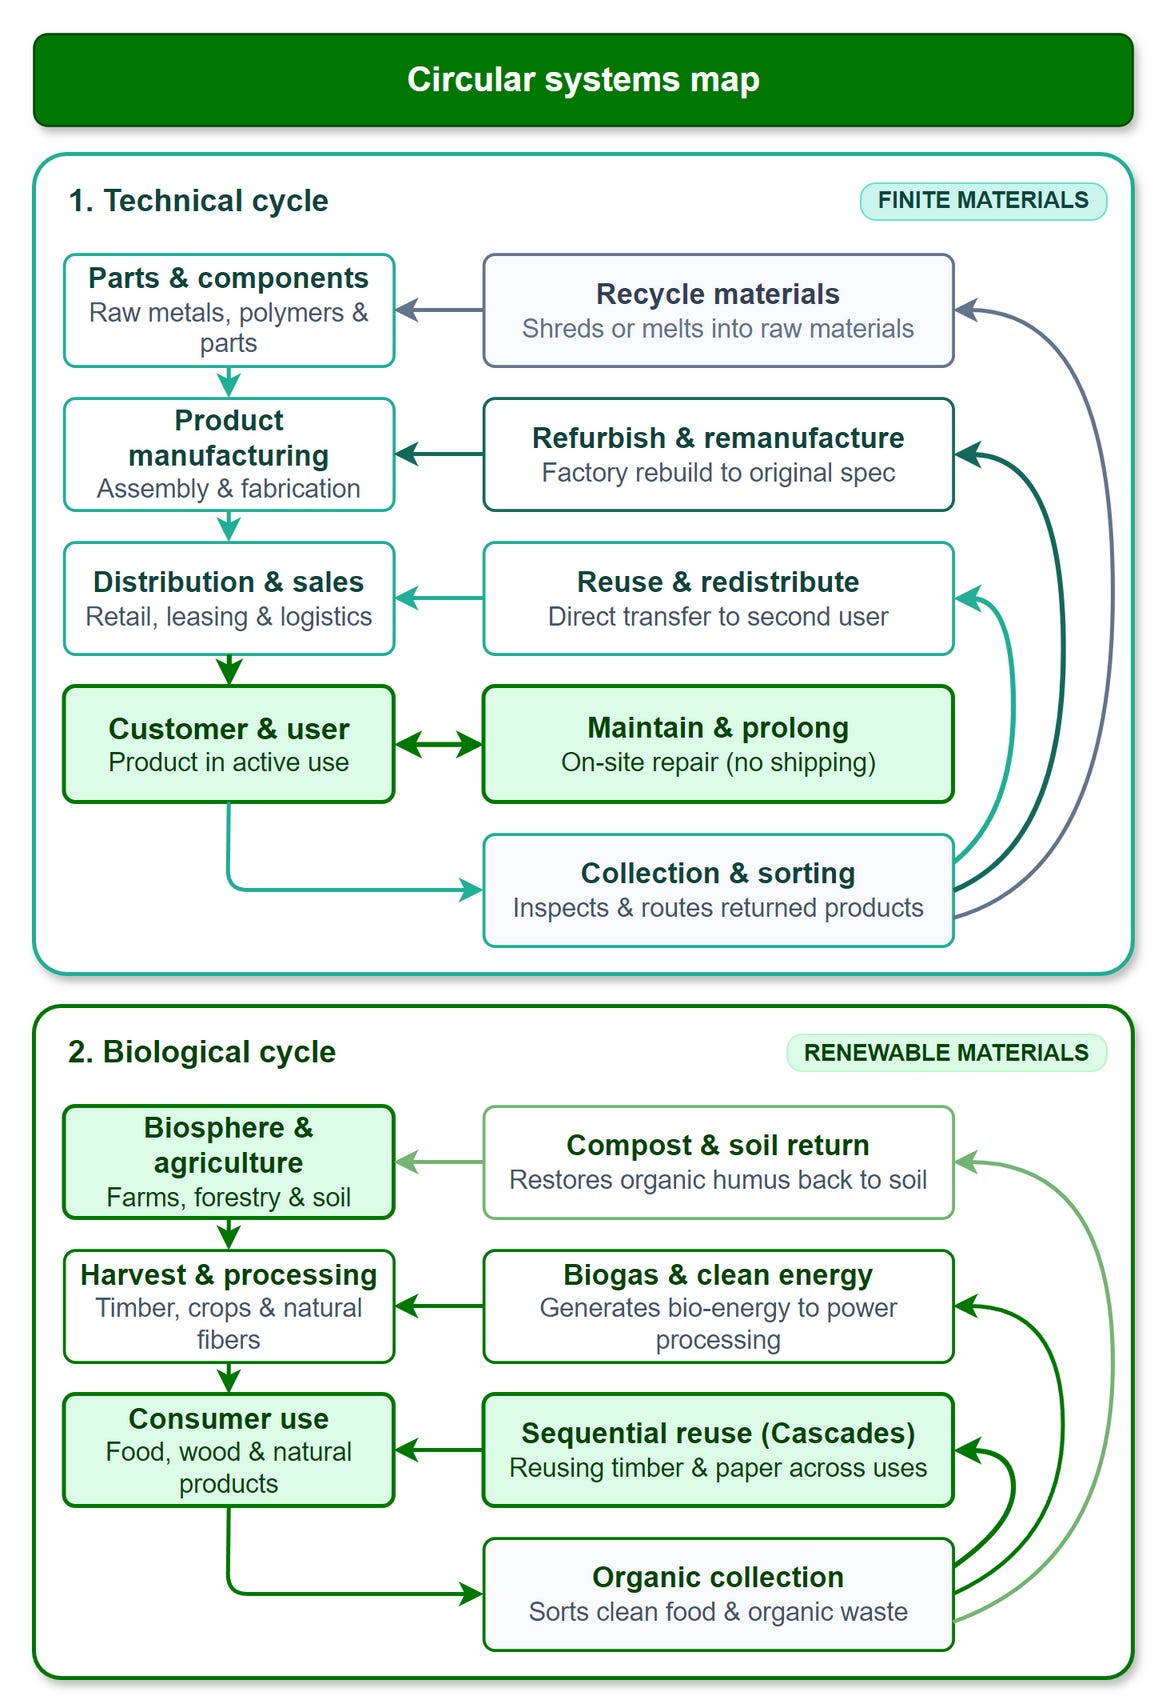
Both cycles depend on material purity. When designers fuse synthetic polymers and natural fibers into what Braungart and McDonough call “monstrous hybrids” (such as plastic-lined paper coffee cups), neither cycle can process them. Plastic prevents biological composting, while paper fibers clog polymer recycling. The hybrid inevitably ends up incinerated or landfilled.
Within each cycle, inner and outer loops represent different recovery pathways. The operational rule is: the tighter the loop, the more value you preserve.
In the technical cycle, on-site maintenance sits closest to the user. Because the product stays where it is used, you protect 100% of its original labor, assembled parts, and precision geometry with zero reverse logistics. Wider loops like remanufacturing or recycling require transport, shredding, and thermal processing, spending substantial energy just to recover basic raw materials.
3. Working down the 10R decision ladder
While the Butterfly Diagram maps the flow of materials, it does not give product teams a step-by-step priority ranking. That operational guidance comes from the 10R framework developed by Potting, Hekkert, Worrell, and Hanemaaijer at the PBL Netherlands Environmental Assessment Agency in 2016.
Evolving from Lansink’s Ladder and European waste legislation, the 10R framework ranks circular strategies on a ten-level scale from R0 down to R9. The lower the number, the more material, labor, and economic value you retain. These ten strategies can be grouped into three practical tiers, moving from design prevention down to raw material recovery.
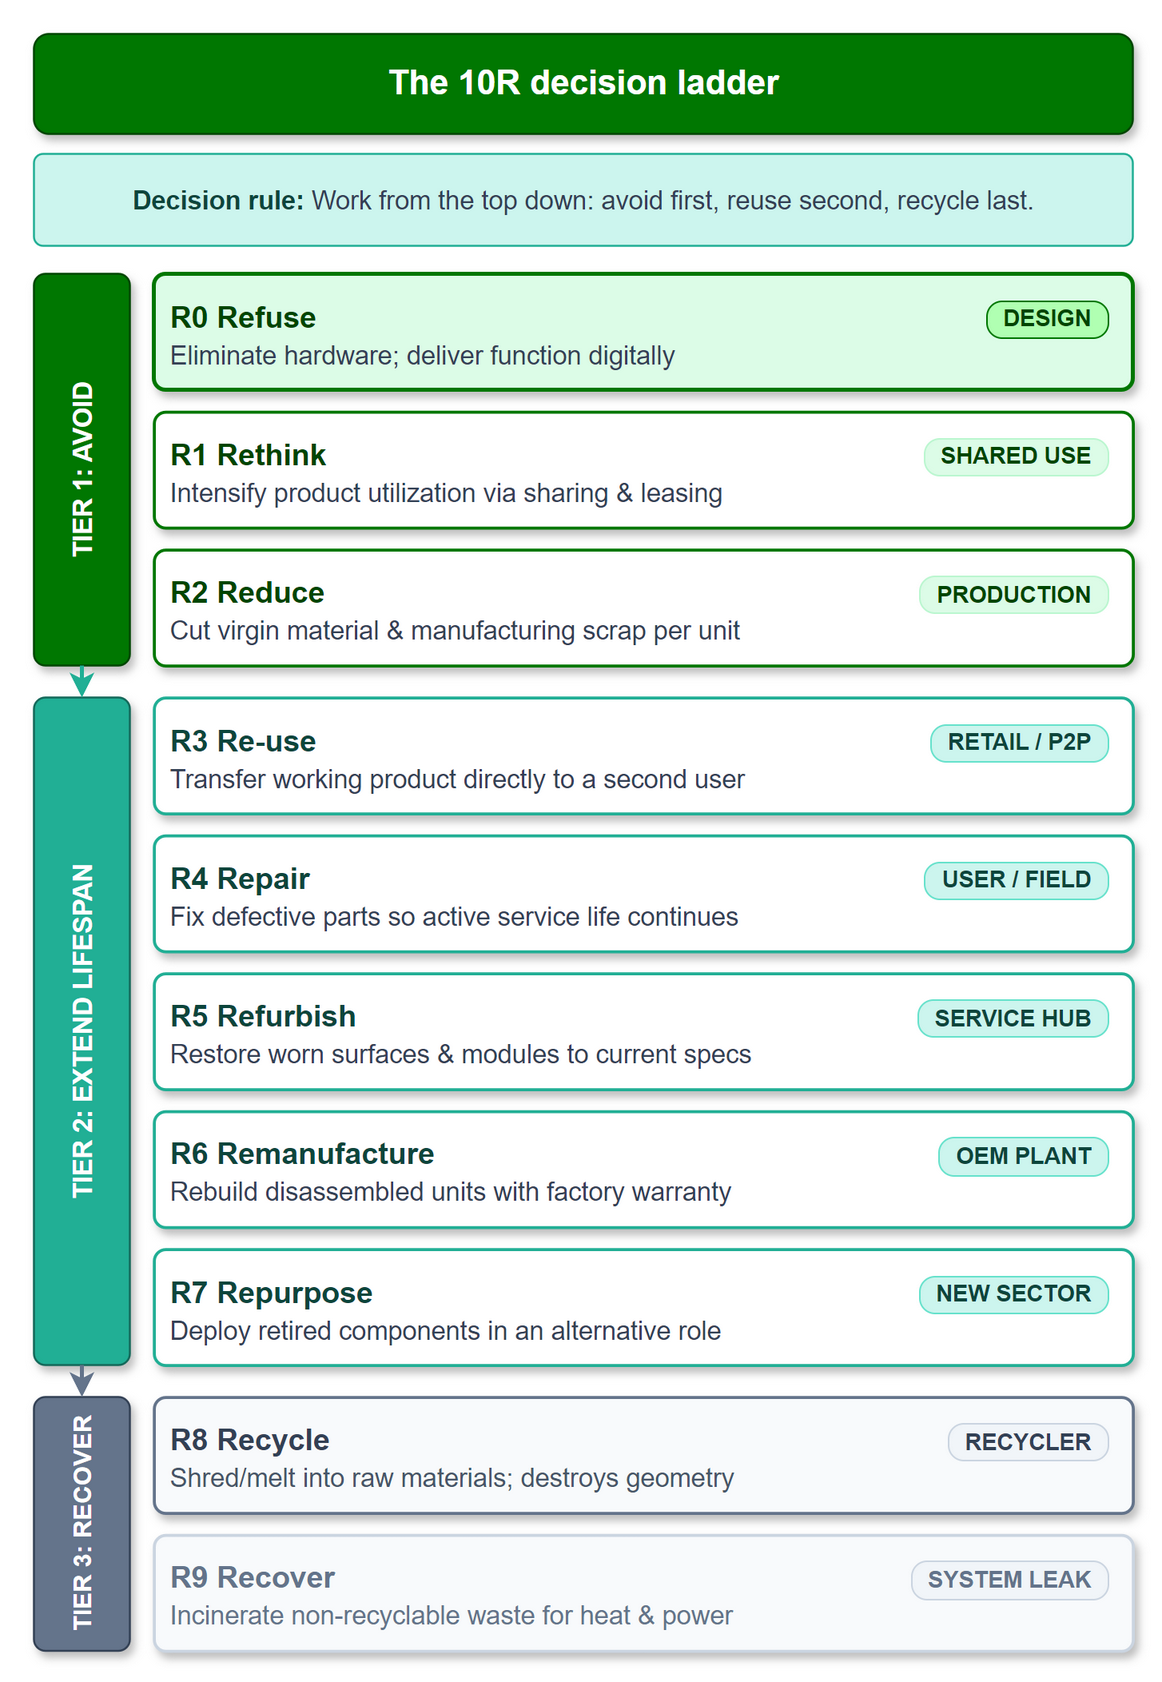
Tier 1: Smarter product use and manufacture (R0–R2)
This top tier avoids using new resources before production starts.
R0 Refuse: Cut out unnecessary physical items or deliver the same function through non-physical alternatives. Examples include packaging-free retail, solid formulations that eliminate disposable plastic bottles, or replacing paper forms with digital verification.
R1 Rethink: Maximize how often each product is used. Rather than selling individual machines that sit idle for 90% of their working lives, businesses rely on shared equipment pools, leasing models, or multi-functional designs.
R2 Reduce: Cut the quantity of raw material needed to make each product. This includes lightweighting parts, cutting out factory scrap, and improving production efficiency.
Tier 2: Extending product lifespan (R3–R7)
Keep products working. This middle tier maintains parts and components in active service at their original quality level.
R3 Re-use: Pass a working product in good condition straight to a second user, with no factory rework required.
R4 Repair: Fix broken parts on-site or in a local repair shop so the customer can keep using the original item.
R5 Refurbish: Update an older unit by replacing worn components and refreshing surfaces to bring it back to current performance standards.
R6 Remanufacture: Disassemble retired equipment in a factory, rebuild parts back to original manufacturer standards, and sell a like-new unit backed by a full factory warranty.
R7 Repurpose: Put a retired product or component into a completely new role, such as using retired electric vehicle batteries for stationary power grid storage.
Tier 3: Useful application of materials (R8–R9)
This bottom tier deals with products that have reached the end of their usable life, breaking down their shape to recover materials or energy.
R8 Recycle: Shred or melt down components into secondary raw materials. The original product structure is lost. Quality can match virgin material in clean, closed loops, or degrade into lower-grade uses during downcycling.
R9 Recover: Burn non-recyclable residual waste to produce electricity or district heating, capturing usable heat energy as material exits the circular economy for good.
4. Mapping the decision ladder onto the circular loops
The 10R strategies map onto product design and four return loops across the technical cycle:
