The systematic measurement of energy performance is the cornerstone of any robust Energy Management System (EnMS). While the international standard ISO 50001 establishes the high-level framework for managing energy, ISO 50006 offers the technical guidance on how to measure it.
This article translates that technical guidance into action via 6 steps. It provides the methodology needed to transform raw utility data into a sophisticated system of Energy Performance Indicators (EnPIs) and Energy Baselines (EnBs).
For any organization, moving from simple bill tracking to a normalized system is the difference between guessing and knowing exactly where your efficiency stands.
In this article, you’ll learn:
✅ The fundamental framework: The relationship between Energy Baselines, Performance Indicators, and energy targets. ✅ How to set boundaries using energy fence diagrams. ✅ How to distinguish routine relevant variables (like weather and production) from static factors (like building size). ✅ The different types of EnPIs—choosing the right indicator for each user ✅ Establishing your historical baseline and utilizing three different methods to calculate energy savings. ✅ Visualizing your success with SEC, X-Y Scatter, and CUSUM charts, along with the specific operational triggers that require you to reset your baseline.
1. The fundamental framework of energy performance
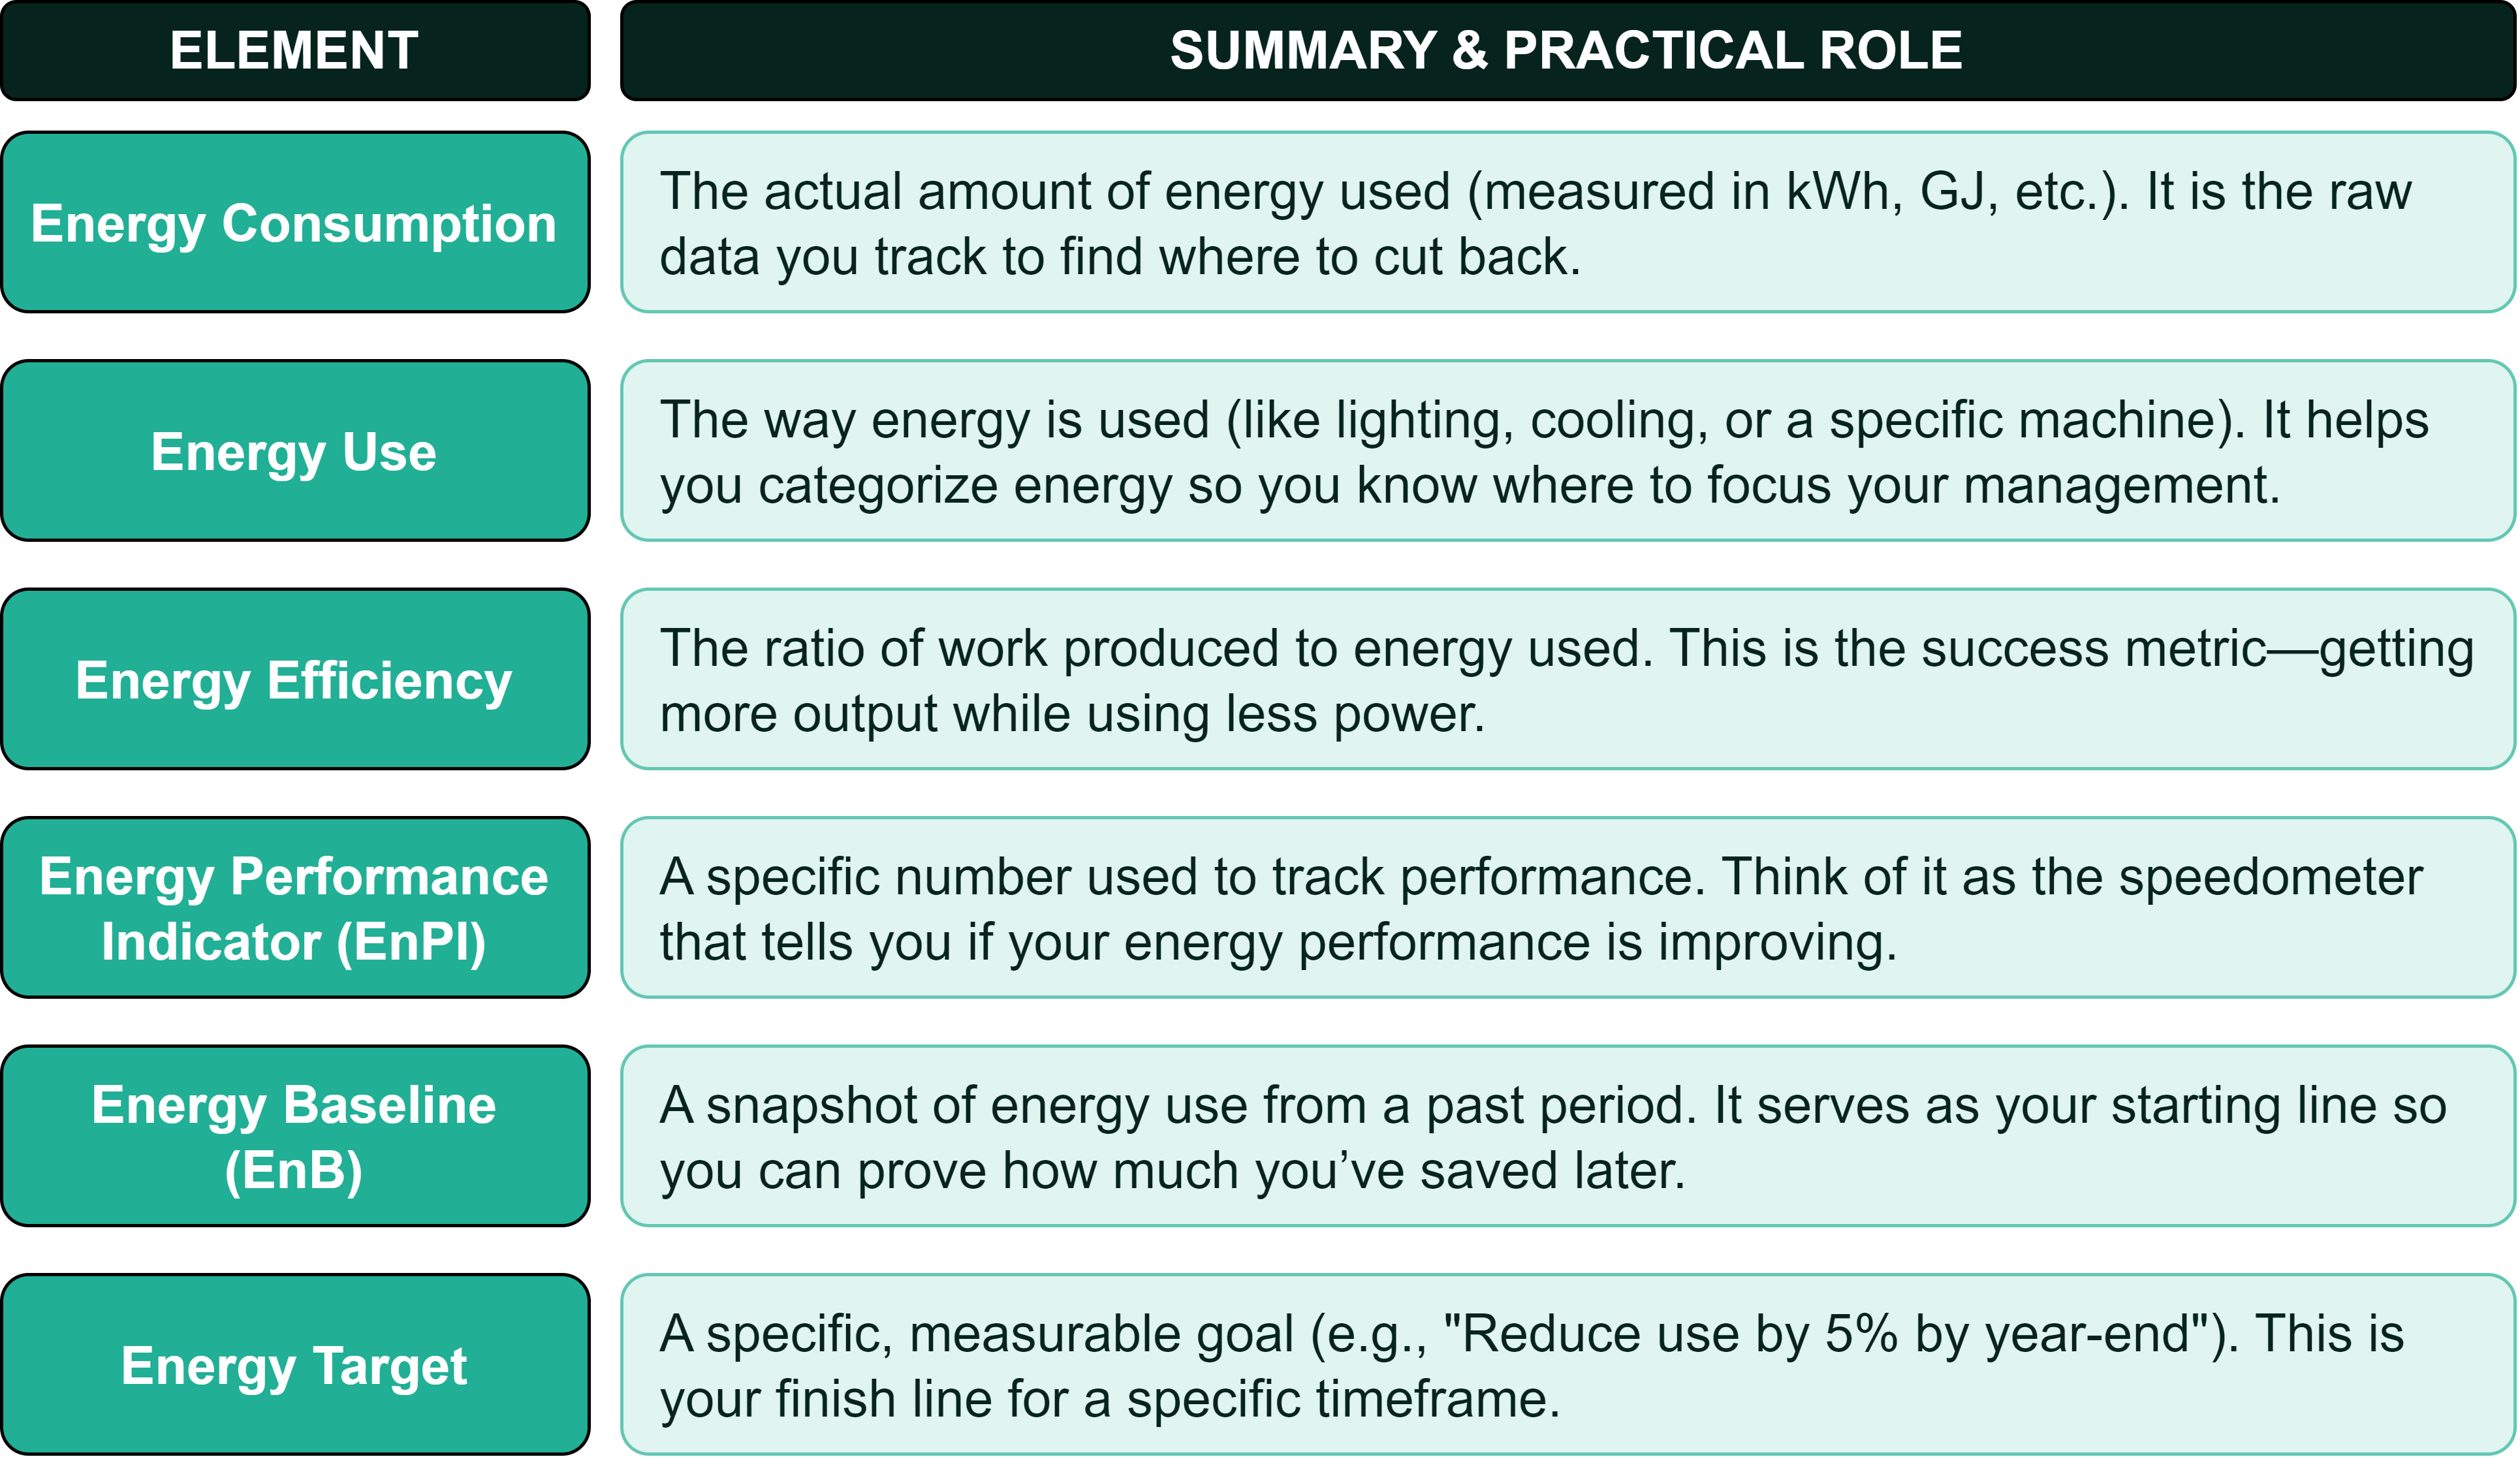
Energy performance itself is a broad concept, encompassing three distinct but interrelated categories: energy consumption, energy use, and energy efficiency. To manage these effectively, an organization must understand the core relationship between its performance metrics and its reference points.
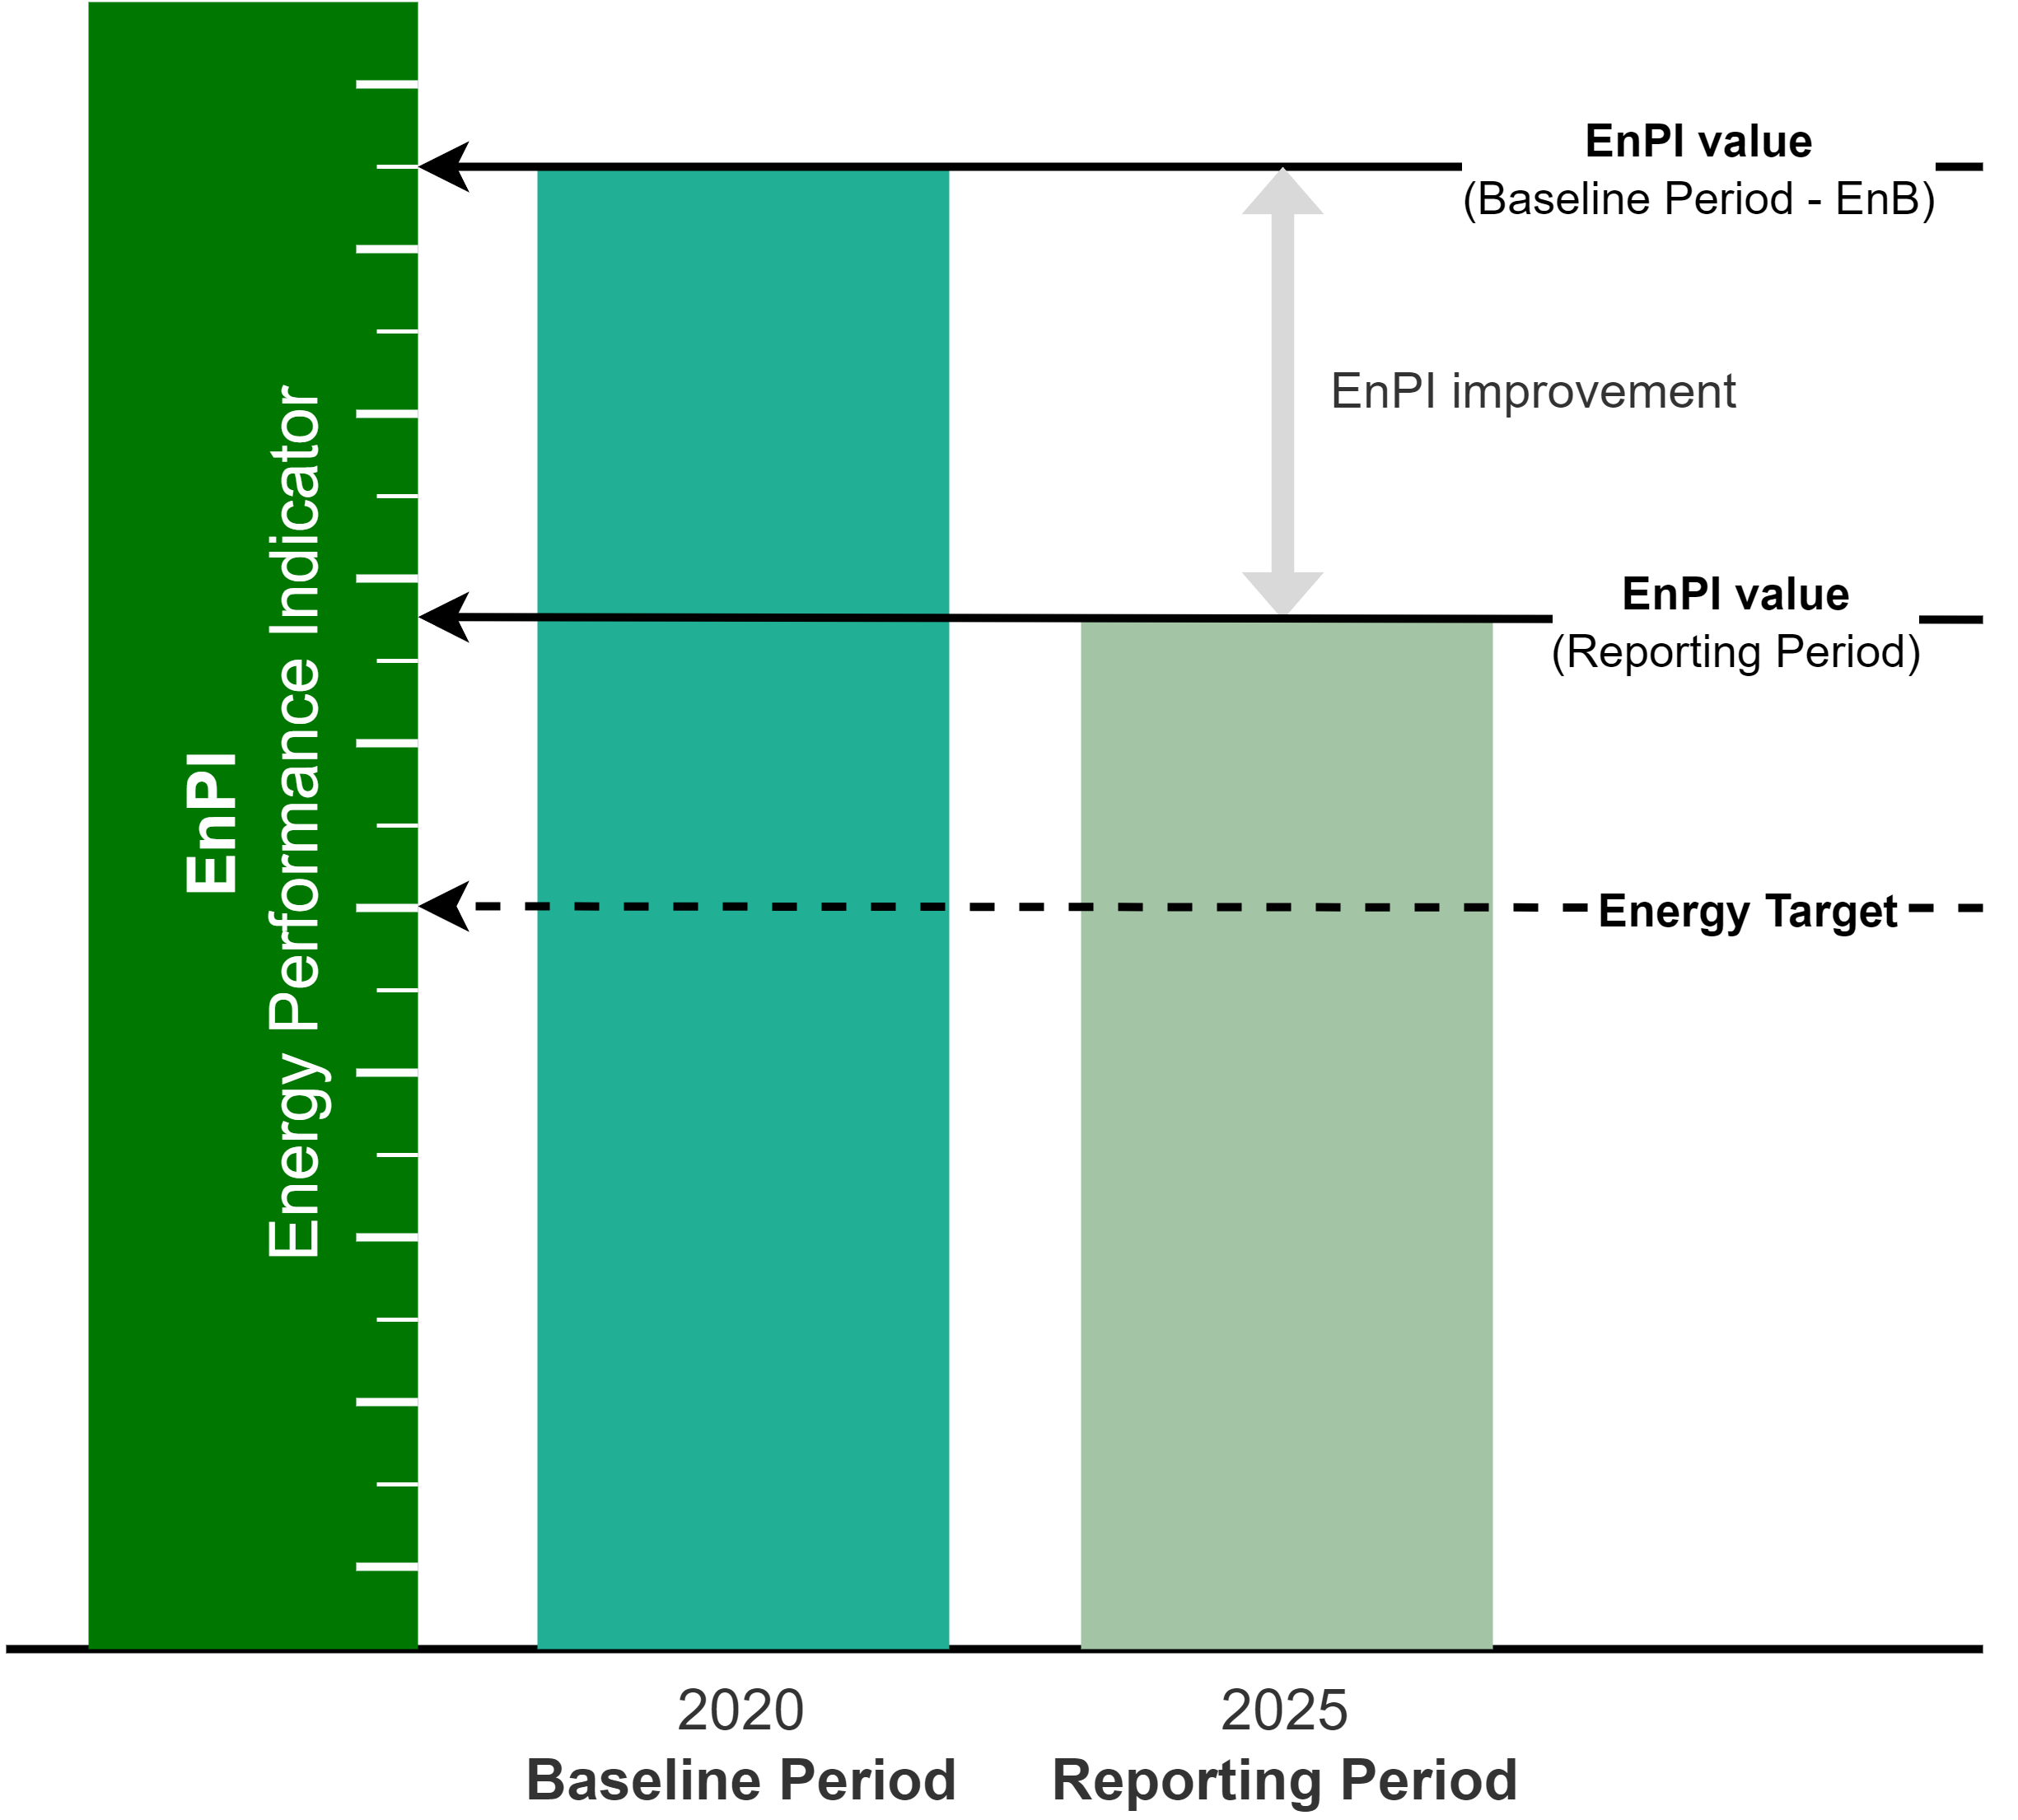
The interrelationship between EnPIs, EnBs, and energy targets is the engine of continual improvement:
EnPI (Energy Performance Indicator): A quantitative value or measure of performance. It could be a simple number, a ratio, or a complex mathematical model .
EnB (Energy Baseline): A quantitative reference period. It is the “yardstick” against which current performance is measured.
Energy Target: A specific, quantifiable requirement you intend to meet.
EnPI Improvement: The gap between your current performance and your baseline.
2. A 6-step guide to proving energy savings
Before we dive into the math and methodology, here is a high-level look at the six steps required to build an energy measurement system from the ground up:
Now, let’s break down how to execute each of these steps.
Step 1: Setting the perimeter: EnPI boundaries
Before you can measure anything, you must define where the measurement starts and stops. There are three levels of boundaries :
Individual level: A physical perimeter around a single piece of equipment or process (e.g., a boiler or a production line).
System level: A group of facilities or equipment interacting together (e.g., the steam production system plus the dryers that use that steam).
Organizational level: The entire site or multiple sites under management control.
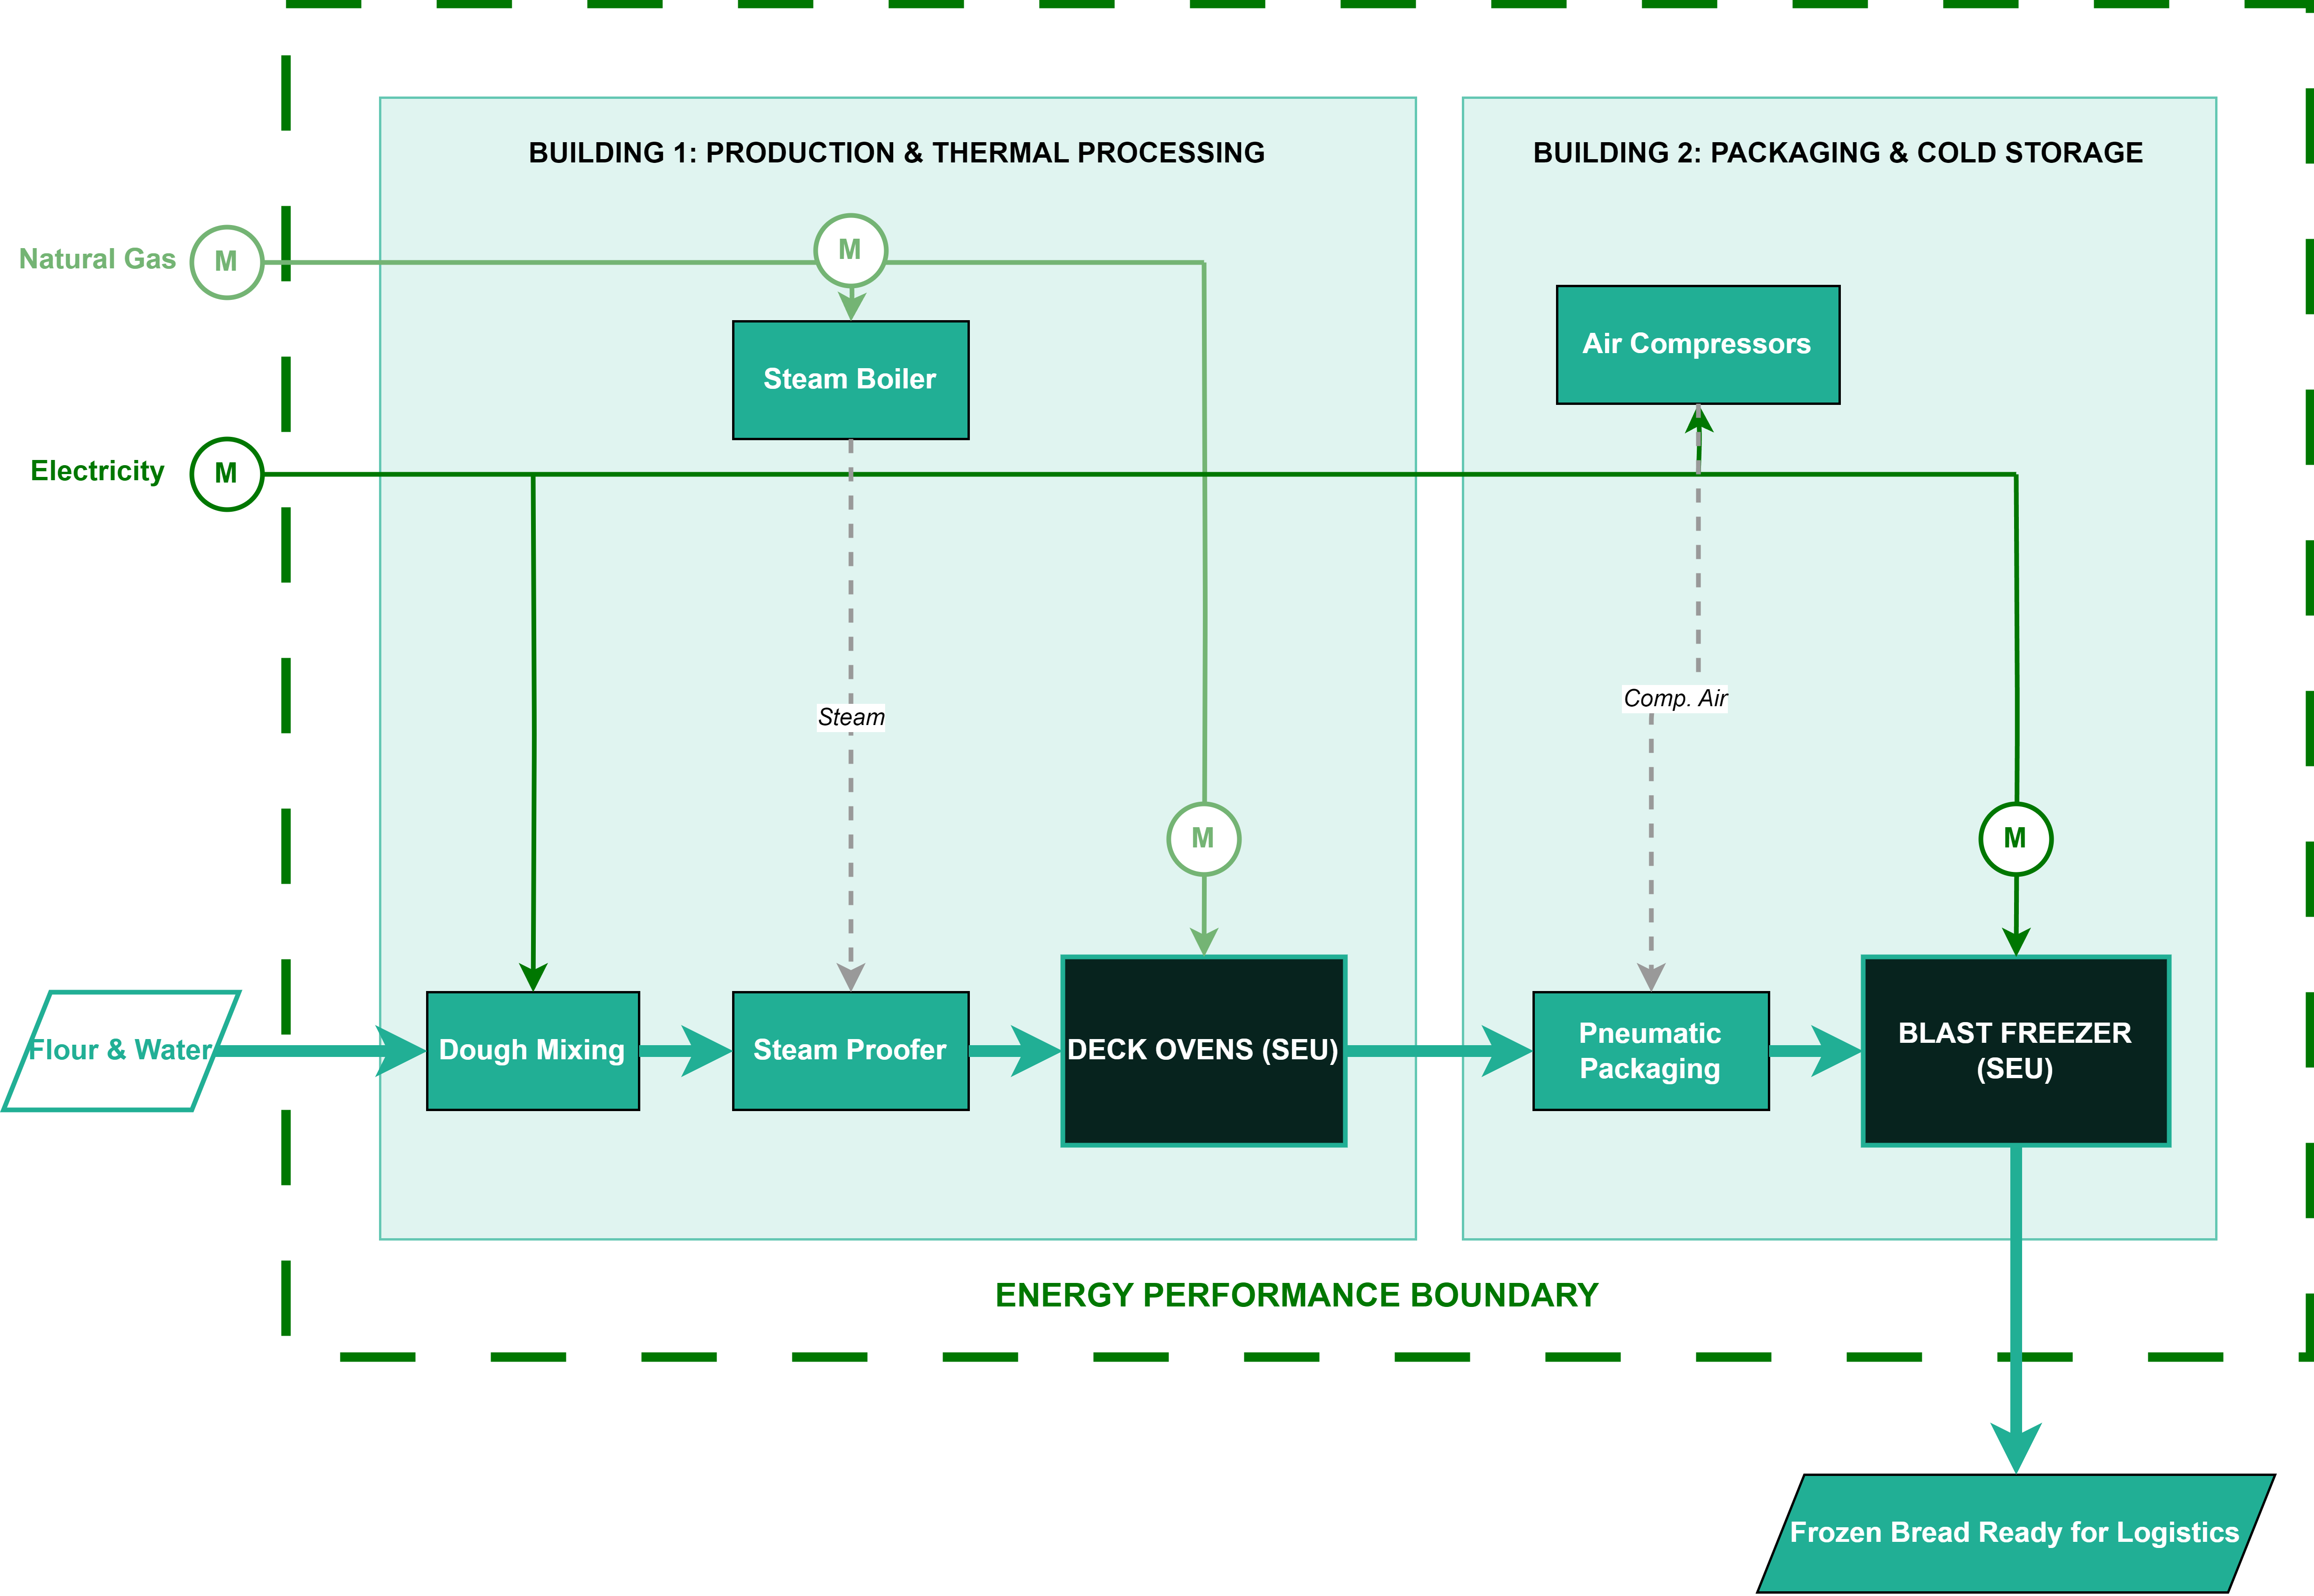
To visualize these boundaries, you can make a fence diagram or, in other words, an energy map.
This is a schematic map of your facility. A bold line (the fence) is drawn around the area you are measuring. Raw energy inputs like natural gas and electricity are shown entering the fence at specific metering points (M). Inside the fence, the diagram maps how that energy flows to different departments. You can show the largest energy users with the tag SEU (Significant Energy Use). An energy fence visualization ensures you know exactly which meters belong to which indicator.
Step 2: Variable analysis: relevant variables and static factors
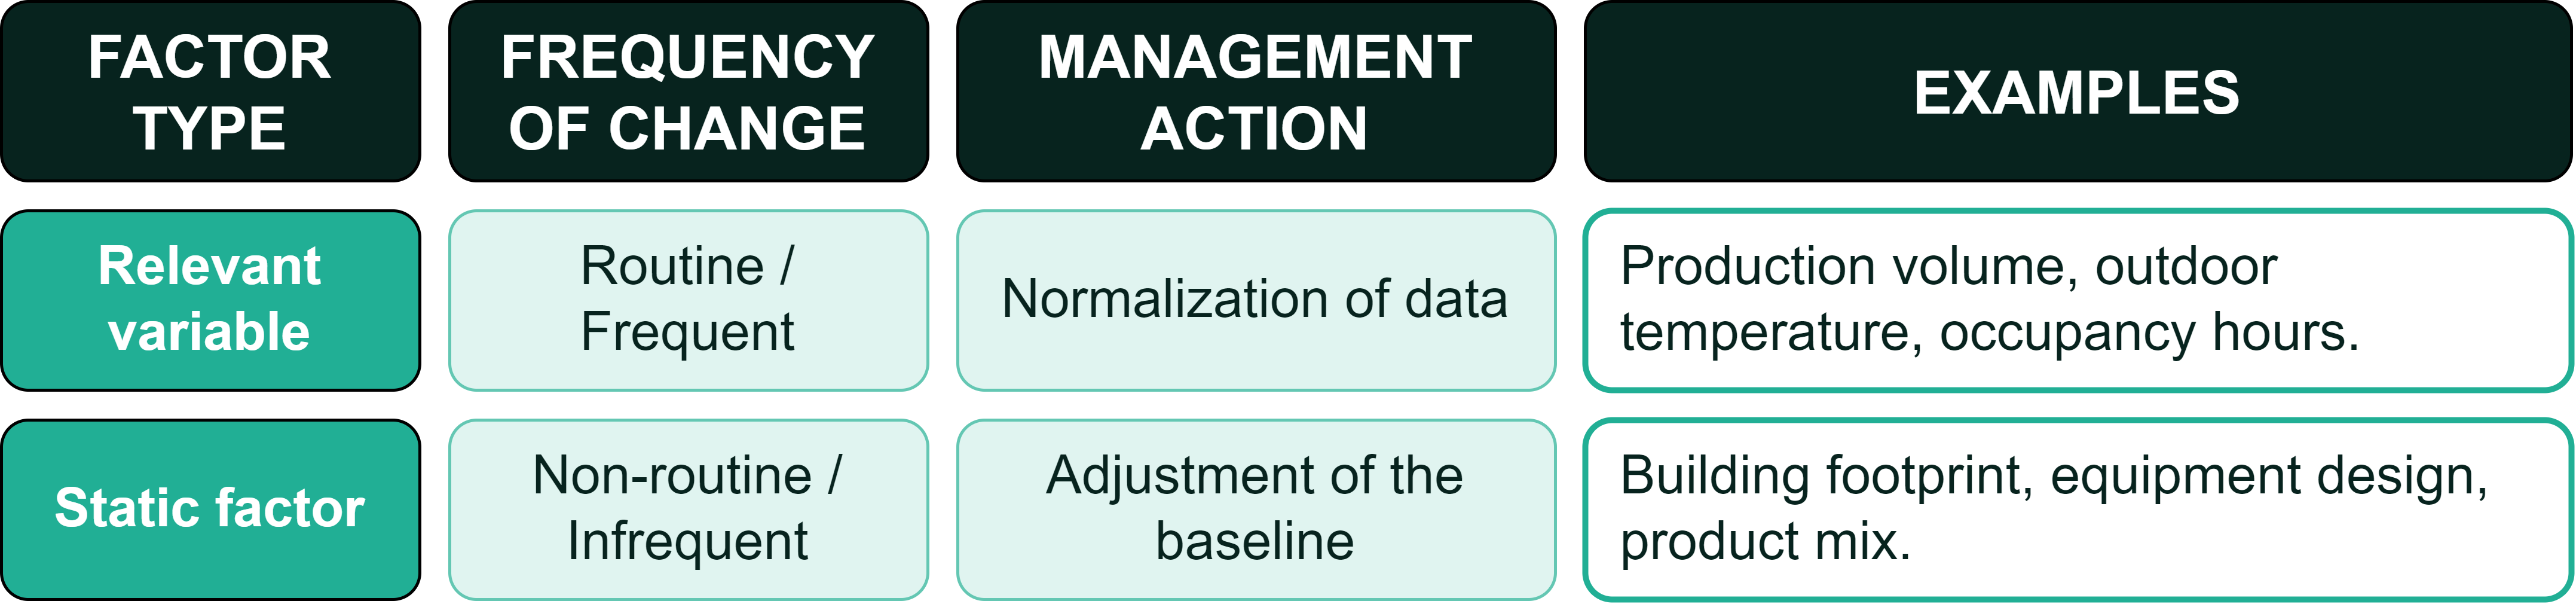
Once the boundary is set, you must account for factors inside and outside that boundary that influence energy performance. We distinguish between two types of factors: relevant variables and static factors.
Relevant variables
Relevant variables are quantifiable factors that impact energy performance and change routinely. Common examples include production parameters (e.g., tonnage, units produced), weather conditions (e.g., outdoor temperature, degree days), and operating hours. Because these factors change frequently, they must be used to normalize energy data. Normalization is the process of routinely modifying energy data to account for these changes, allowing for a fair comparison between the baseline and reporting periods.
Determining significance
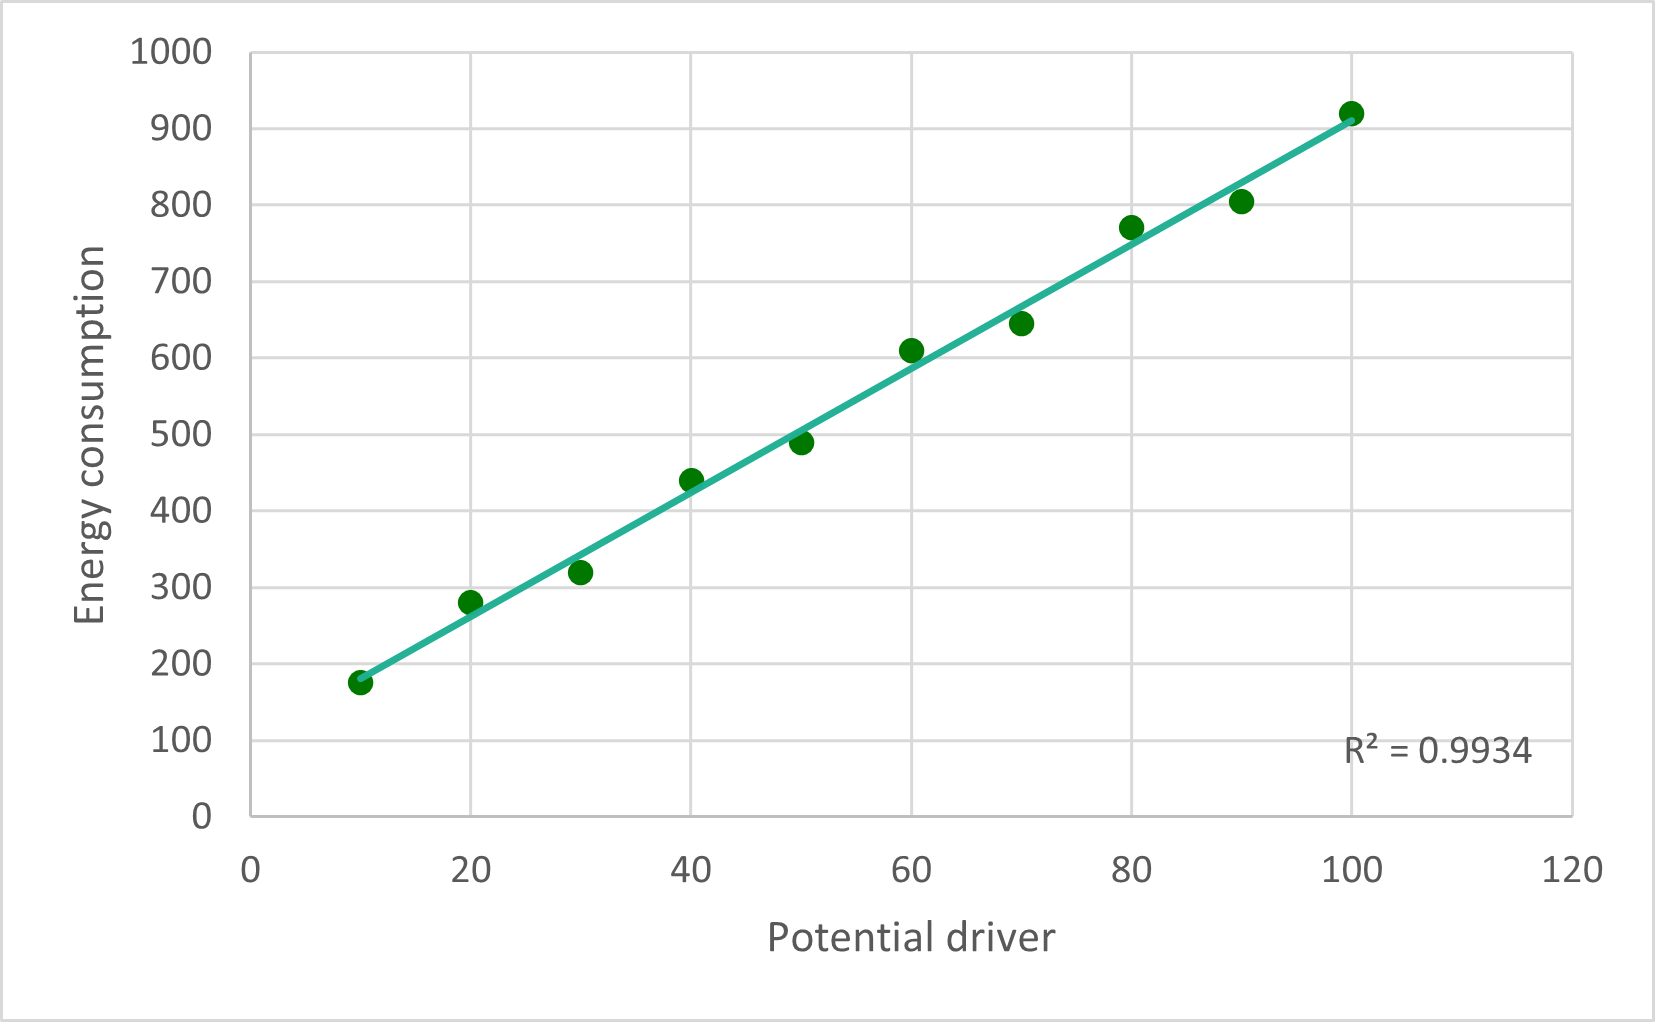
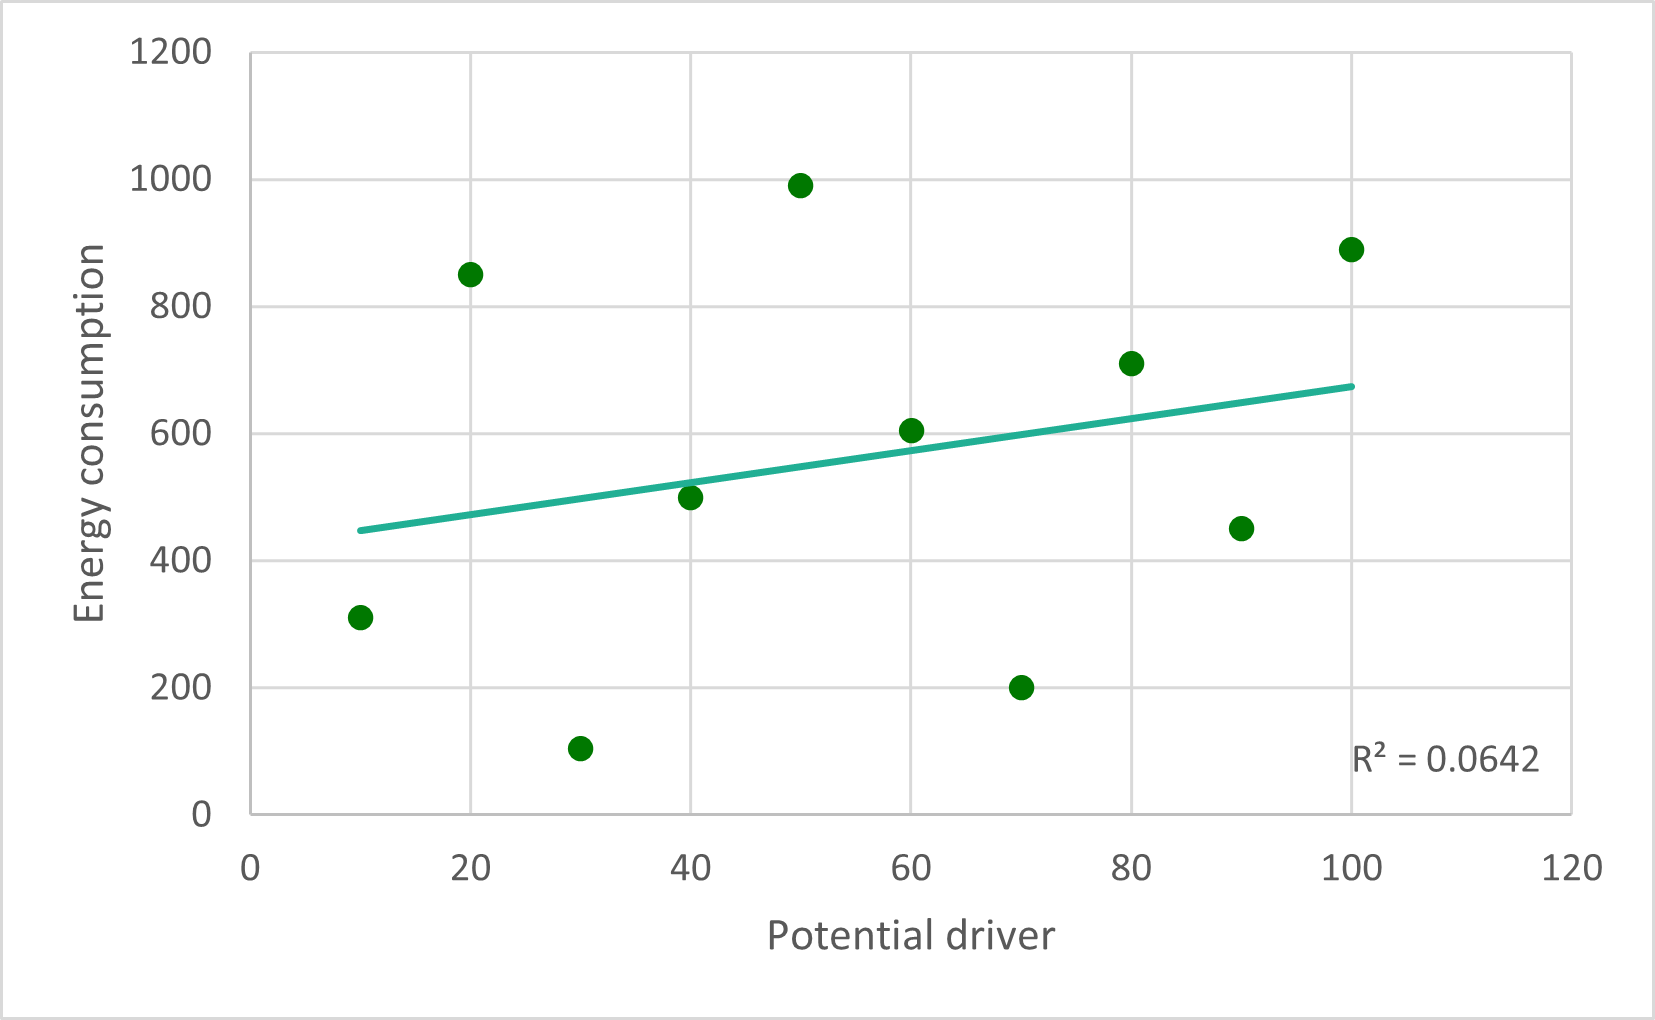
To determine the relevance of specific variables, it is essential to visualize the relationship between your potential drivers and energy consumption. This is typically achieved by plotting the potential driver (e.g., outdoor temperature or production volume) on the horizontal axis and energy use on the vertical axis of an X-Y scatter diagram.
Based on the resulting visual distribution, you can categorize the variable into one of two scenarios:
Scenario A: High correlation (significant variable)
If the data points form a clear path or cluster tightly around a mathematical trend line, the variable has a high correlation.
Interpretation: This indicates that when the variable changes, energy consumption changes in a predictable manner.
Action: Keep this variable. It is a significant driver and should be included in your Energy Performance Indicator (EnPI) model.
Scenario B: No correlation
If the data points appear as a random, scattered cloud with no discernible direction, there is no meaningful relationship between the two factors.
Interpretation: The variable has little to no impact on your energy usage.
Action: Exclude this variable. Removing irrelevant data prevents over-complicating the model and ensures your performance tracking remains accurate.
Focusing only on significant variables ensures your sustainability reporting and energy management systems are built on credible, actionable data.
Static factors
Static factors are identified factors that impact energy performance but do not routinely change. Examples include facility size, the design of installed equipment, the number of production shifts, and the range of products manufactured. While static factors remain constant during typical operations, a significant change in one (such as a factory expansion or a switch from manufacturing aluminum to plastic parts) constitutes a change in the equivalent conditions of the baseline.
Step 3: The different types of EnPIs: Choosing indicators & matching them to users
With boundaries defined and variables analyzed, you can select the right type of EnPI. Each offers a different level of detail and suitability for various stakeholders.
Keep reading with a 7-day free trial
Subscribe to Sustainability Simplified (publisher of CSRD Simplified) to keep reading this post and get 7 days of free access to the full post archives.