

[INSIGHT] Managing biodiversity: frameworks and tools for action
ESRS E4: Managing biodiversity: frameworks and tools for action

1. Introduction
Biodiversity loss is no longer an abstract environmental concern. For companies across all sectors, it presents tangible risks and strategic implications. Ecosystem degradation can disrupt supply chains, devalue assets, increase regulatory burdens, and erode public trust. As global policy and investor pressure rise, businesses are expected not only to avoid harming biodiversity—but to actively help restore it.
Managing biodiversity strategically requires clarity, data, and structure. That’s where emerging frameworks and tools come in. These systems help companies locate where they interact with nature, evaluate risks and impacts, set measurable targets, and report transparently on progress. They transform biodiversity from a vague sustainability topic into a manageable part of enterprise decision-making.
This topic intersects directly with global frameworks such as:
The Corporate Sustainability Reporting Directive (CSRD), which mandates biodiversity disclosures (ESRS E4)
The Kunming–Montreal Global Biodiversity Framework, which sets a global goal to halt and reverse biodiversity loss by 2030.
By reading this article, you will learn:
✅ How four key biodiversity tools (TNFD, SBTN, ENCORE, IBAT) help companies operationalize nature goals
✅ Which sectors use each tool and why
✅ The practical challenges and limitations to expect
✅ Additional tools that fill niche roles in a biodiversity strategy
This article will help you understand how to incorporate biodiversity tools into your company’s sustainability journey, regardless of your industry or current level of maturity.

2. What biodiversity tools are designed to do
Biodiversity tools can be grouped into three practical categories. This makes it easier to understand how they work together.
1. Risk and impact identification tools
These tools help you locate where your business interacts with nature, through operations, supply chains, or financing. They highlight where you depend on ecosystem services (like water and soil) and where your activities may put pressure on ecosystems.
2. Target-setting tools
These translate important pressures and dependencies into measurable, science-aligned goals.
3. Disclosure and governance frameworks
These guide how companies report nature-related risks, opportunities, and governance to investors and regulators.
The four most widely used tools — TNFD, SBTN, ENCORE, and IBAT — span these categories. In practice, companies often use them together. Let’s explore each one.
3. TNFD: framing biodiversity as financial risk
Purpose
The Taskforce on Nature-related Financial Disclosures (TNFD) helps companies and financial institutions identify, assess, manage, and disclose nature-related risks and opportunities. It aims to bring biodiversity into core business and financial decision-making.
Structure
TNFD uses four pillars that mirror the well-known TCFD climate framework*:
Governance
Strategy
Risk and impact management
Metrics and targets
This makes TNFD familiar territory for teams already working on climate disclosures.
*Read about the TCFD here:
![[BREAKDOWN] E1-2: Scenario analysis with the TCFD](https://substackcdn.com/image/fetch/$s_!rTGI!,w_140,h_140,c_fill,f_webp,q_auto:good,fl_progressive:steep,g_auto/https%3A%2F%2Fsubstack-post-media.s3.amazonaws.com%2Fpublic%2Fimages%2F20657086-78d5-4c2d-948b-8af47f39625e_2048x2048.jpeg)
The LEAP process
TNFD is operationalised through the LEAP approach, a four-step sequence:
Locate where your company interacts with nature (sites, sourcing regions, portfolio exposure).
Evaluate your dependencies and impacts at those locations.
Assess which issues create material risks or opportunities.
Prepare by integrating findings into governance, strategy, processes, and disclosures.
Typical use cases
Manufacturers and extractive companies use TNFD to map where their operations touch high-risk nature areas.
Banks and investors apply LEAP across portfolios to spot nature-related financial risk.
Companies use TNFD to turn fragmented data into a consistent governance and reporting structure.
Challenges
Requires detailed spatial and supply chain information.
Boundaries for biodiversity assessments are more complex than for greenhouse gas emissions.
TNFD is a framework — not a dataset — so companies must combine it with other tools.
Check it out here: The Taskforce on Nature-related Financial Disclosures
4. SBTN: turning ambition into science-based targets for nature
Purpose
The Science Based Targets Network (SBTN) helps companies set measurable, science-aligned targets for nature. It extends the idea of science-based targets from climate into broader environmental domains.
Focus areas
SBTN covers several realms, with land and freshwater being the most advanced:
Freshwater
Land and ecosystem conversion
Pollution
Climate (through SBTi)
Biodiversity and ocean (guidance expanding in phases)
The target-setting process
SBTN follows a clear, stepwise method:
Assess—map pressures and dependencies across your value chain.
Interpret and prioritise—identify where the most significant issues lie.
Measure, set, and disclose—create baselines and define science-aligned targets.
Act—implement actions across operations and suppliers.
Track—monitor progress and adjust when needed.
Typical use cases
Food and beverage companies use SBTN to set no-conversion and regenerative sourcing commitments.
Consumer goods companies apply SBTN guidance to manage freshwater risks in high-stress basins.
Companies integrate SBTN targets into procurement policies and supplier requirements.
Challenges
Biodiversity-specific methods are still expanding.
Requires strong internal data on sourcing locations.
Needs alignment with other commitments (e.g. deforestation, climate, water stewardship).
Check it out here: Step Up For Nature – Science Based Targets Network
5. ENCORE: understanding nature dependencies across sectors
Purpose
ENCORE (Exploring Natural Capital Opportunities, Risks and Exposure) helps organisations understand how economic activities depend on and impact ecosystem services.
What ENCORE provides
A sector-to-ecosystem-service matrix that shows which ecosystem services are most critical to each activity.
Materiality ratings (e.g., high, medium, low) indicating dependency strength.
Insights into how degradation of ecosystem services could disrupt activities.
Typical outputs
ENCORE produces clear visual results, such as:
A matrix showing how an industry depends on pollination, soil formation, water flow, or other ecosystem functions.
Portfolio-level overviews for financial institutions, showing which sectors carry the highest nature-exposure risk.
Use cases
Banks use ENCORE to screen portfolios for sectors with high nature exposure.
Corporate sustainability teams use it as a first step in double materiality assessments.
Companies use ENCORE to prioritise where deeper analysis is needed.
Challenges
ENCORE provides sector-level insights, not site-specific data.
It highlights dependencies strongly; understanding full impacts usually requires additional tools.
It identifies risk, but does not quantify financial outcomes.
Check it out here: ENCORE
6. IBAT: mapping biodiversity risk on the ground
Purpose
The Integrated Biodiversity Assessment Tool (IBAT) provides detailed, site-level information about biodiversity sensitivity.
Key data layers
IBAT combines several globally recognised datasets:
Protected areas (WDPA)
Key Biodiversity Areas (KBAs)
IUCN Red List species ranges
Ecosystem types
What IBAT produces
Site screening reports showing overlaps with protected areas, threatened species ranges, and high-value ecosystems.
Maps and summaries useful in due diligence, land-use planning, and sourcing decisions.
Use cases
Mining, energy, and infrastructure companies use IBAT to screen potential project sites.
Procurement teams use IBAT to avoid sourcing from high-biodiversity-sensitivity areas.
Companies use IBAT to focus environmental assessments where the risks are highest.
Challenges
Data coverage varies across regions.
IBAT identifies sensitivity, not full ecosystem service loss.
Additional assessments are usually required for detailed planning.
Check it out here: IBAT | Services
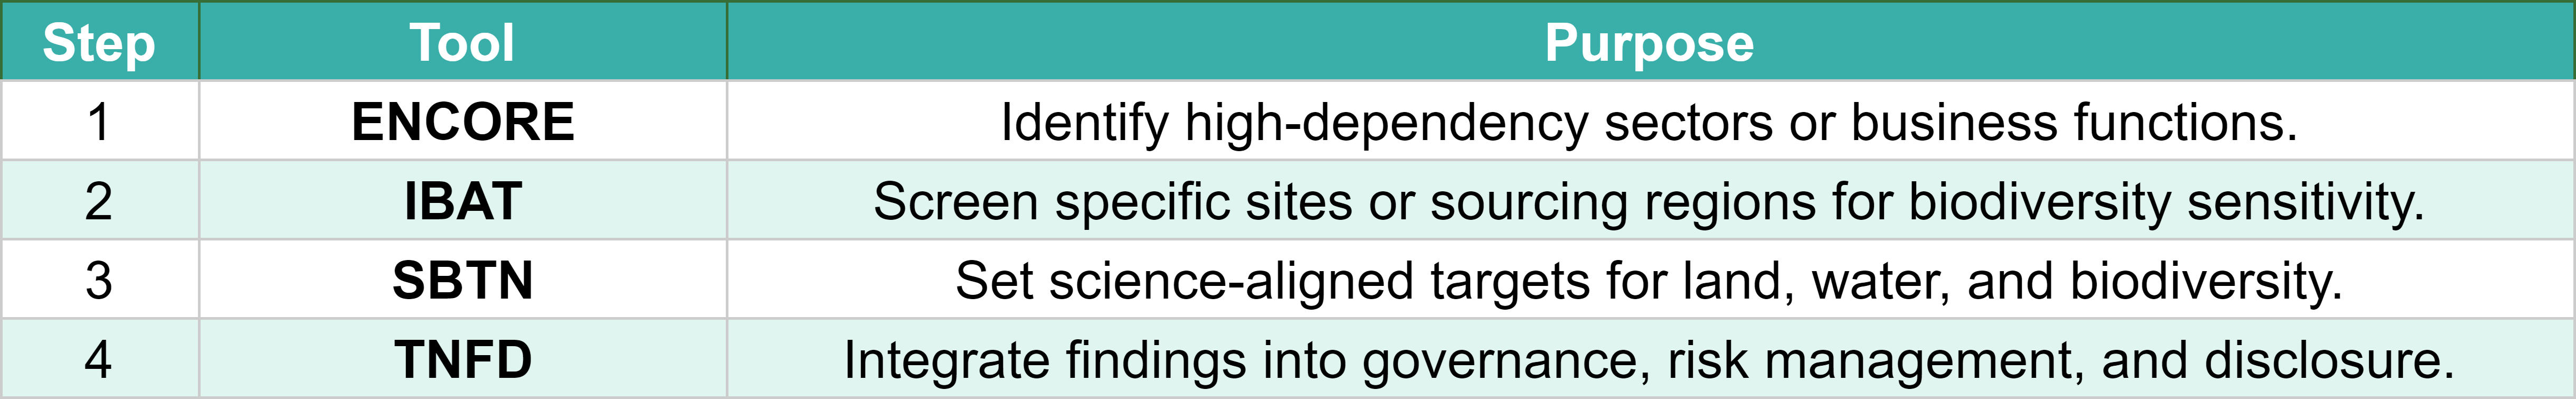
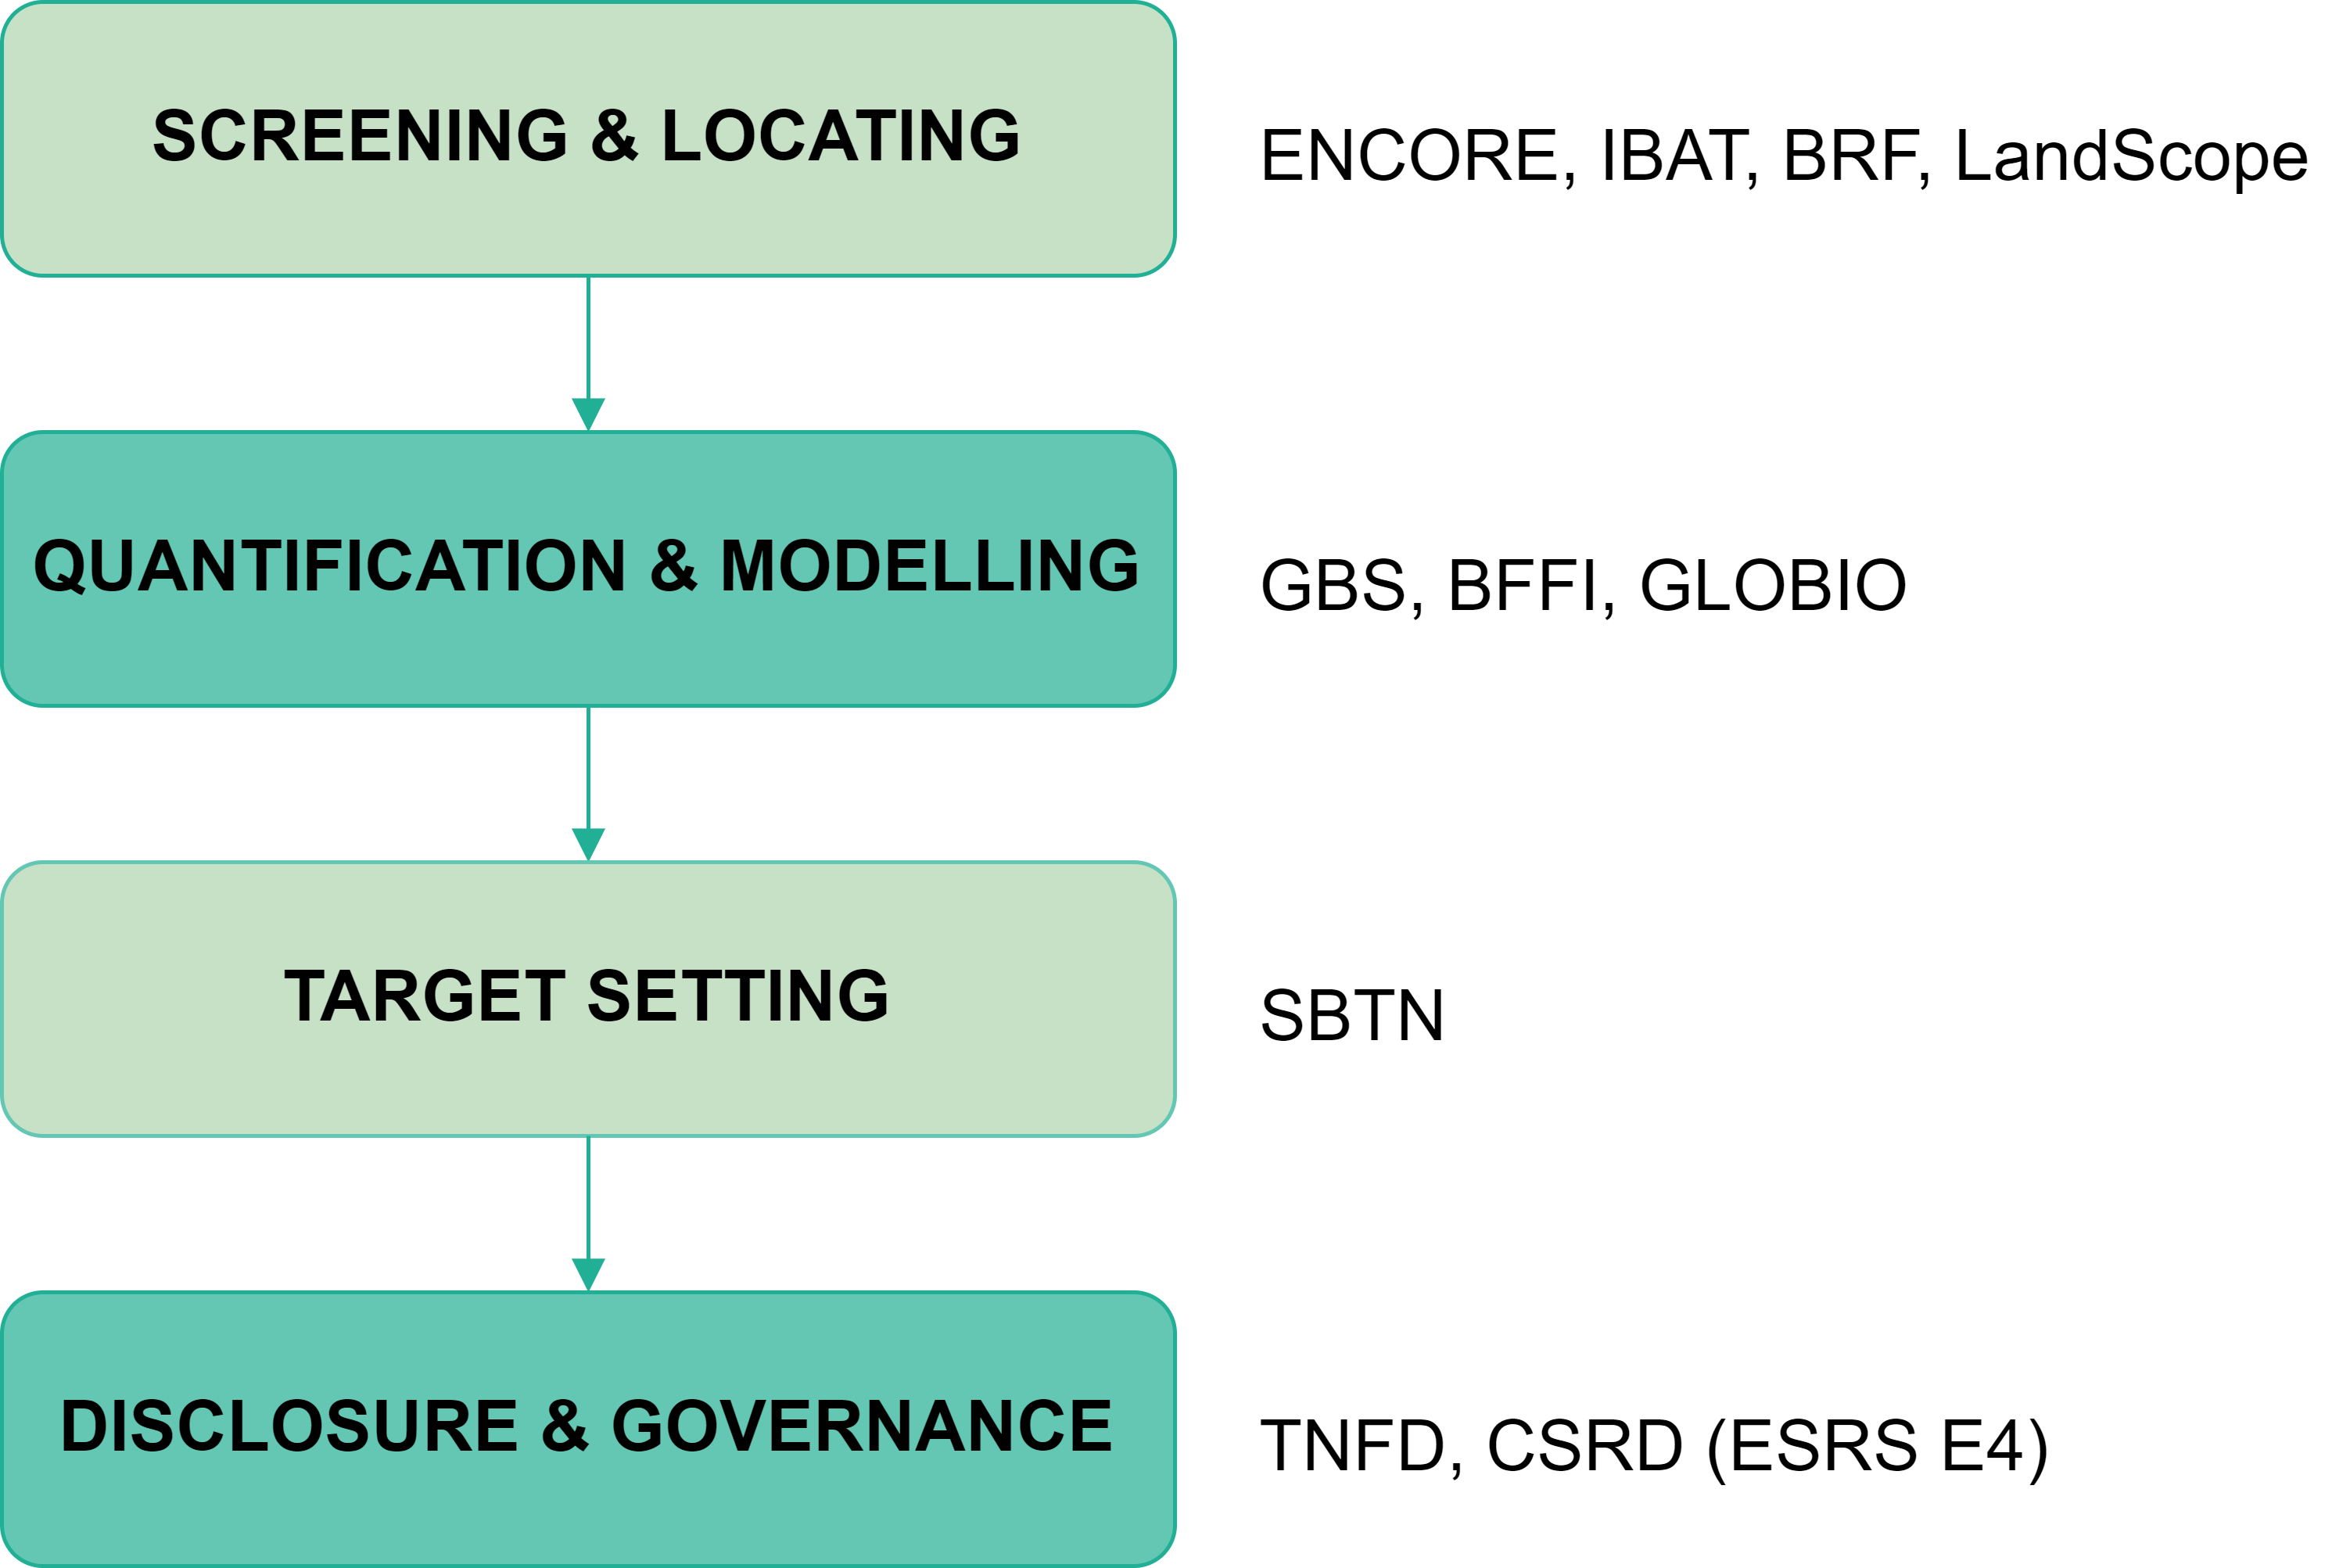
7. How these tools work together: a typical biodiversity workflow
Companies that work seriously with biodiversity rarely use these tools alone. A practical sequence looks like this:
8. Other useful tools that support biodiversity integration
Beyond the main four tools, several additional resources play complementary roles:
WWF Biodiversity Risk Filter (BRF)
Type: Global risk-screening platform
Best for: Early-stage biodiversity and nature risk assessments across operations and supply chains
BRF is a map-based dashboard that screens locations around the world for biodiversity-related risks. It evaluates both ecosystem condition and human pressures, making it useful for companies seeking a quick understanding of nature-related exposure.
When to use it
When you need a first screening to see which regions carry high nature-related risks
When you do not yet have detailed site-level data
When evaluating many supplier locations at once
WWF Biodiversity Risk Filter, for the maps see this page: WWF Biodiversity Risk Filter - Explore Maps
Global Biodiversity Score (GBS)
Type: Corporate biodiversity footprint method
Best for: Measuring total biodiversity pressure across a company’s value chain
GBS provides a single numerical score representing a company’s biodiversity pressure. It converts complex environmental impacts into a common biodiversity metric, helping companies compare business units, sourcing regions, or scenarios.
When to use it
When preparing for science-based target validation
When reporting company-wide impacts
When needing to compare biodiversity pressure between different product categories or geographies
Global Biodiversity Score (GBS) | Measure & Act on your Biodiversity Footprint
GLOBIO
Type: Global biodiversity scenario modelling framework
Best for: Strategic foresight, long-term risk assessment, and scenario analysis
GLOBIO is a modelling system that shows how biodiversity intactness may change over time under different development pathways. It is used by governments, NGOs, and companies to understand long-term biodiversity trajectories.
When to use it
When developing long-term nature strategies
When performing scenario analysis for TNFD or CSRD
When assessing exposure to future land-use or climate risks
What is GLOBIO? | GLOBIO - Global biodiversity model for policy support - homepage
BFFI (Biodiversity Footprint for Financial Institutions)
Type: Footprint model for financial portfolios
Best for: Banks, asset managers, insurers, and any organisation with investments
BFFI helps financial institutions estimate biodiversity impacts across their entire investment portfolio, from equity to loans and bonds.
When to use it
When preparing TNFD-aligned portfolio reporting
When identifying high-impact companies in lending or investing
When setting portfolio-wide biodiversity strategies
Biodiversity Footprinting for Financials - Biodiversity Metrics
LandScope (regional platforms)
Type: Regional spatial planning and conservation mapping tools
Best for: Real estate, infrastructure developers, land-intensive industries
LandScope tools (e.g., LandScope America and other regional variants) integrate local biodiversity data, land-use maps, and conservation priorities. They help decision-makers quickly evaluate the ecological importance of land parcels.
When to use it
When evaluating new project sites
When making real estate or land acquisition decisions
When needing high-resolution local data that ENCORE/IBAT cannot provide
LandScope | Professional Terrain Analysis. No Barriers.
9. Takeaway
Companies have a toolbox for biodiversity at their disposal consisting of:
TNFD structures risk and disclosure
SBTN provides science-based nature targets
ENCORE identifies key dependencies and exposures
IBAT screens site-level biodiversity sensitivity
Tools like BRF, GBS, GLOBIO, and BFFI add depth where needed
Relevant Sources
The Taskforce on Nature-related Financial Disclosures
Step Up For Nature – Science Based Targets Network
WWF Biodiversity Risk Filter - Explore Maps
Global Biodiversity Score (GBS) | Measure & Act on your Biodiversity Footprint
What is GLOBIO? | GLOBIO - Global biodiversity model for policy support - homepage
Biodiversity Footprinting for Financials - Biodiversity Metrics
LandScope | Professional Terrain Analysis. No Barriers.