

[BREAKDOWN] 7 important water metrics you should understand
How to replace vague terminology with clear definitions required for accurate corporate water assessments

1. Introduction
As water scarcity intersects with rising operational costs, how a business manages and talks about water has become a core part of its long-term success.
To navigate this landscape, companies must move away from vague, generalized talk about “water usage” and adopt a clear, precise vocabulary.
This article defines seven water metrics—water use, water withdrawal, water discharge, water consumption, water recycling, water reuse, and water storage. By understanding these distinctions, you can build accurate, reliable water risk assessments.
In this guide, you will learn:
✅ About seven core corporate water metrics and their differences.
✅ The difference between initial water withdrawal and water consumption.
✅ A case study showing all seven metrics in practice.
✅ How to deploy a tool to convert raw volumetric logs into a printable dashboard.
By reading this full article, you will gain the clarity to identify internal circularity opportunities, and clearly communicate your organization’s water stewardship to stakeholders.

2. Seven water metrics explained
To build an accurate water accounting model, an organization must view its operations as a bounded system. Water flows across these corporate boundaries from local environments, moves through internal processes, and either returns to the source or is lost to the local ecosystem.
To capture the full scope of these interactions, established hydrological and environmental engineering practices rely on a combination of seven metrics.
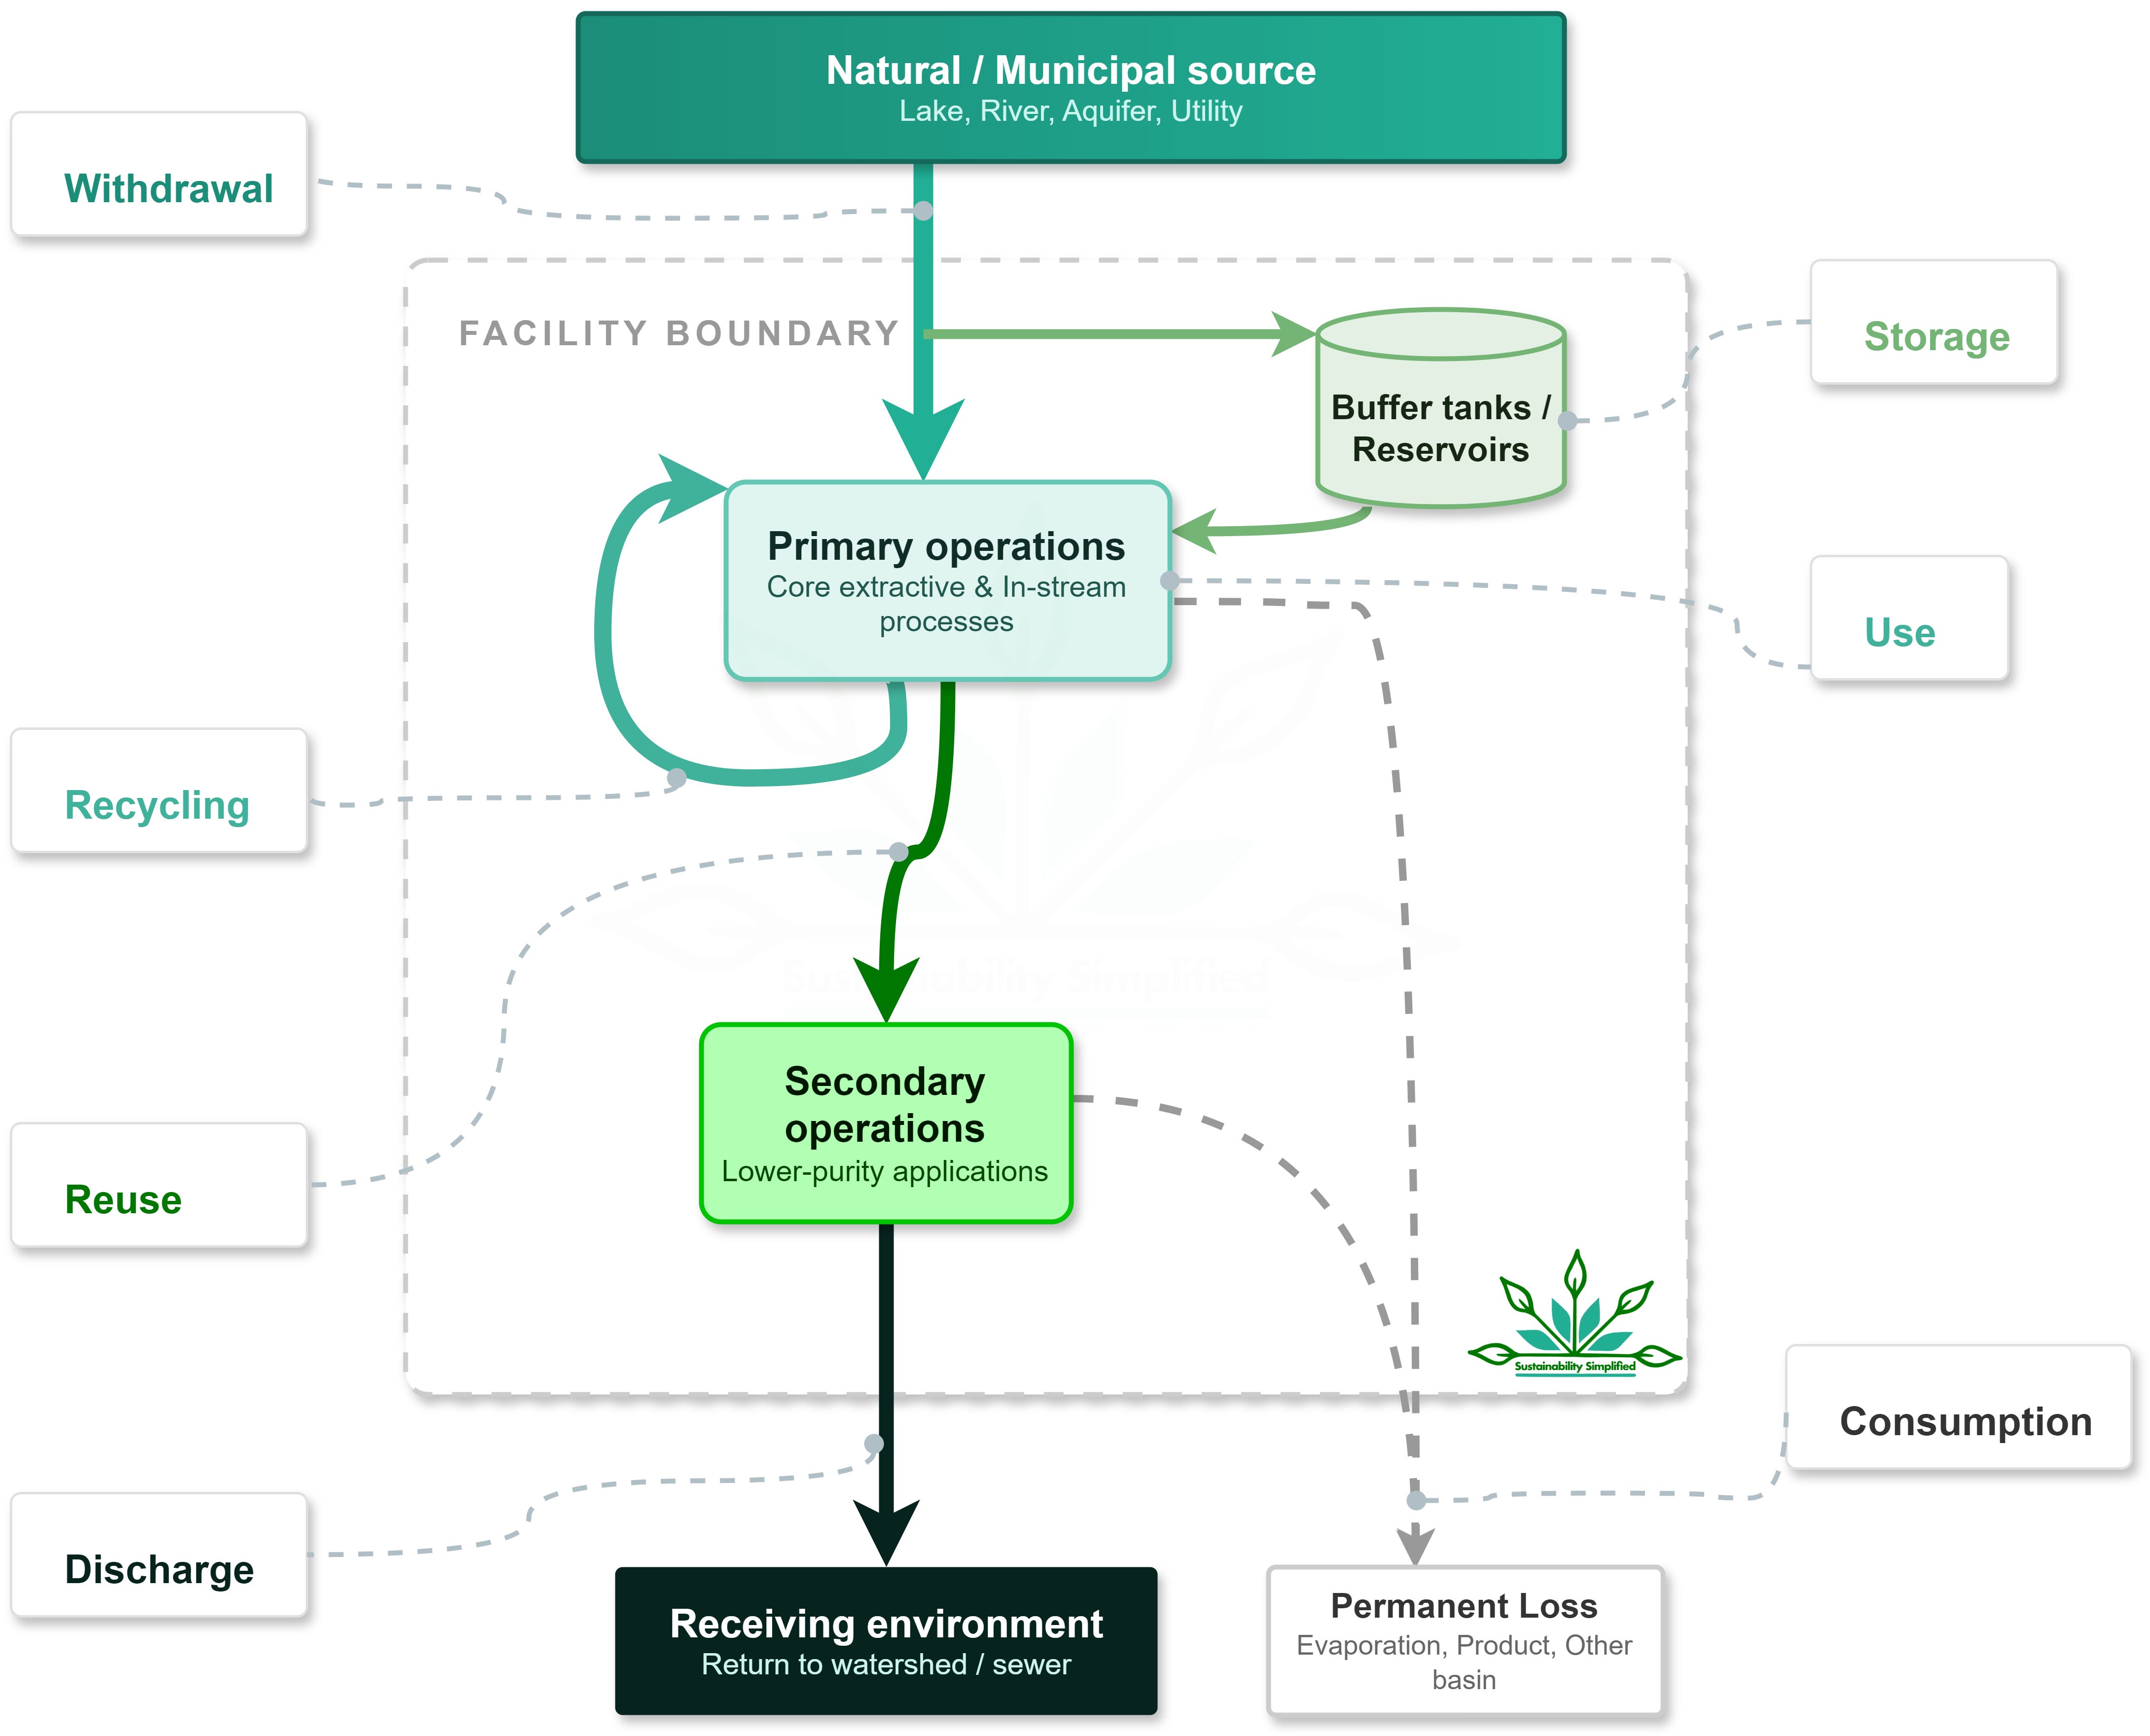
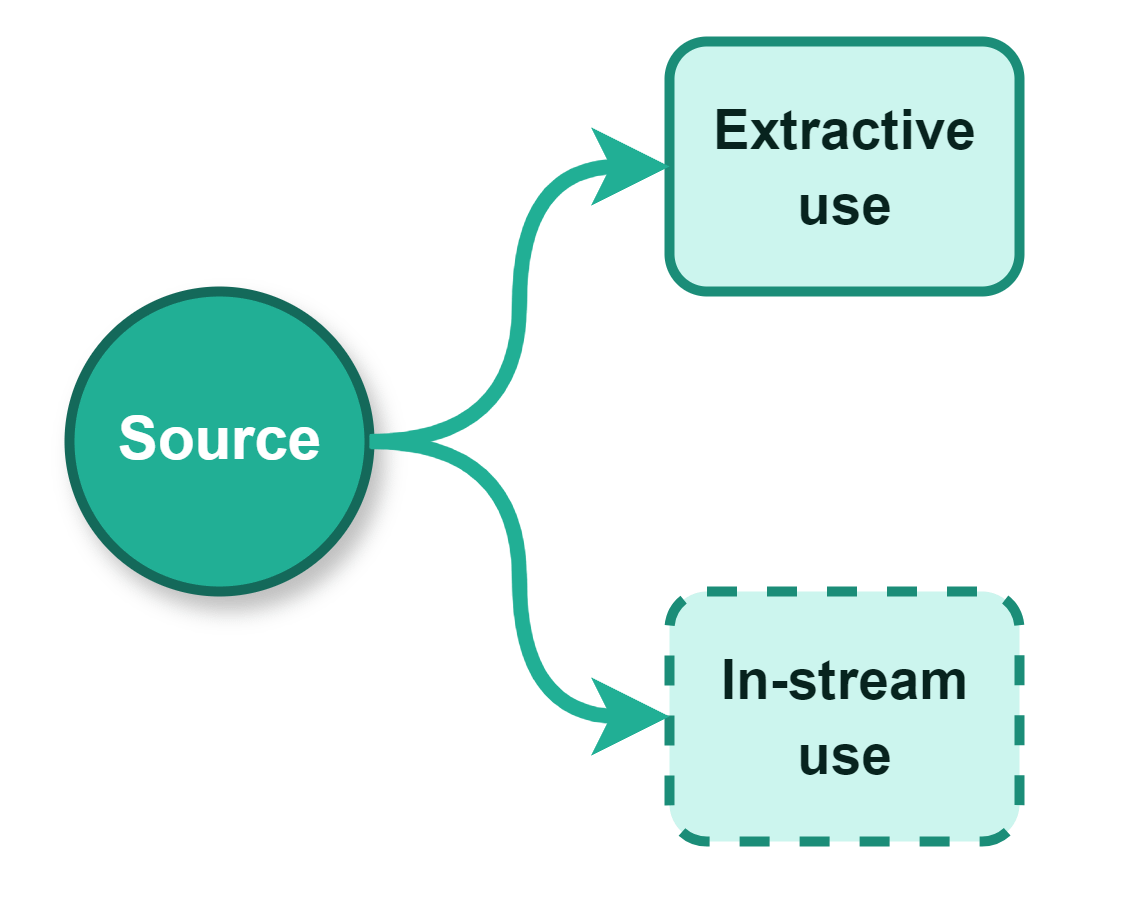
1. Water use
Water use is the broadest classification of human interaction with water resources. It covers all operational processes where water provides a business benefit. Crucially, this includes both activities in which water is physically taken from a source and in-stream activities, in which water provides value right where it sits without being moved.
Because it includes these non-extractive processes, a company can record massive amounts of water use without actually lowering the water level in the surrounding environment.
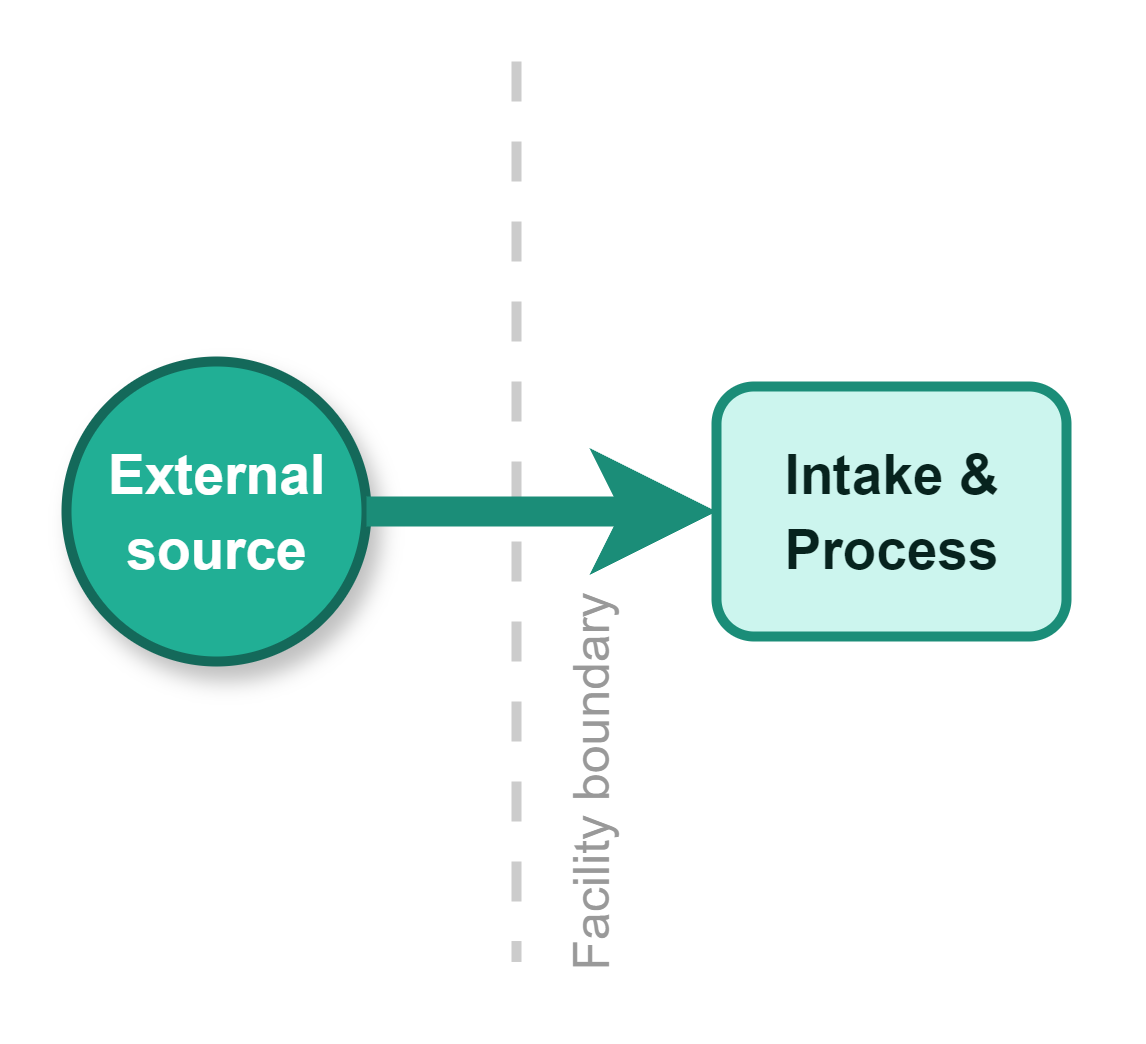
2. Water withdrawal
Water withdrawal is the total absolute volume of freshwater removed from any natural ground or surface water source—such as an aquifer, river, or lake—or from a municipal utility line. This metric must be measured before any portion of that water is treated, recirculated, or discharged. It serves as the primary indicator of the initial, immediate demand a company places on local water supplies.
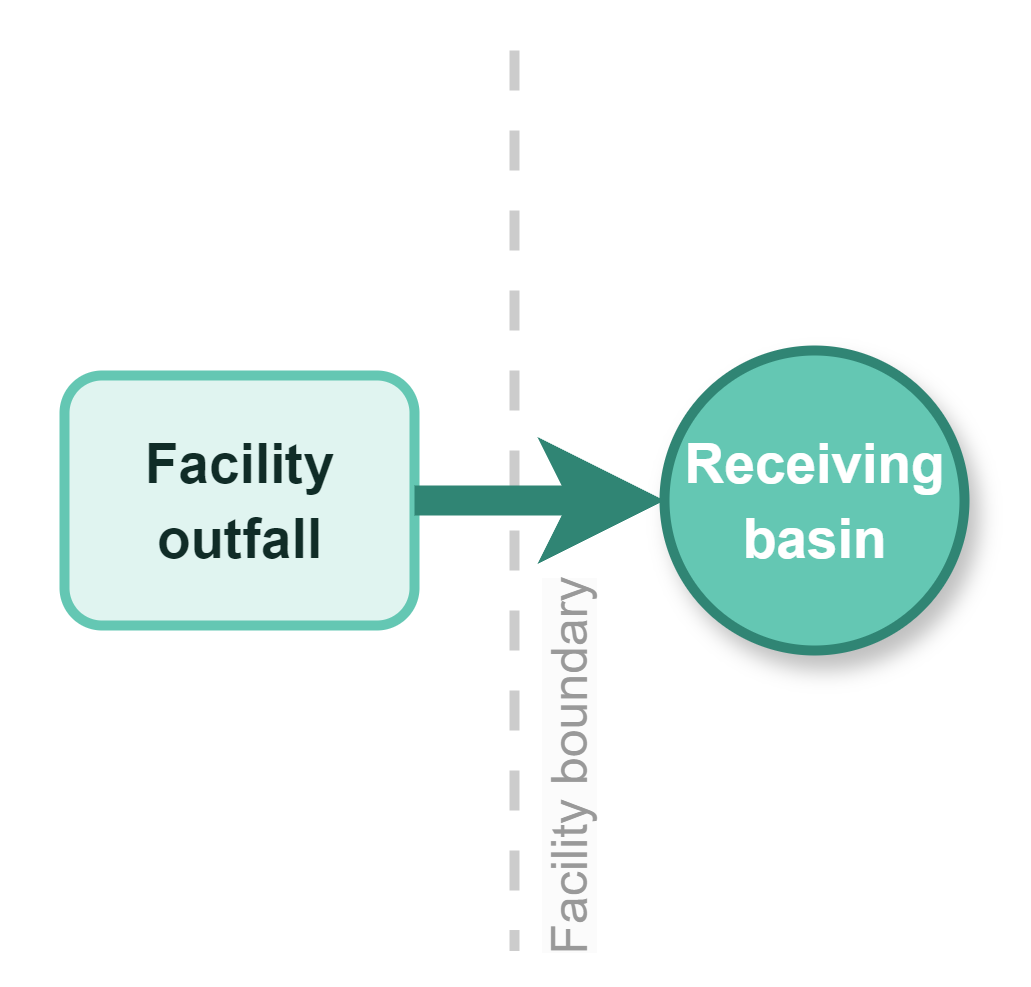
3. Water discharge
Water discharge is the total volume of water that has passed through an operational system and is then released intentionally back into the environment. This includes returns made to surface water bodies, oceans, underground injection wells, or municipal wastewater treatment networks.
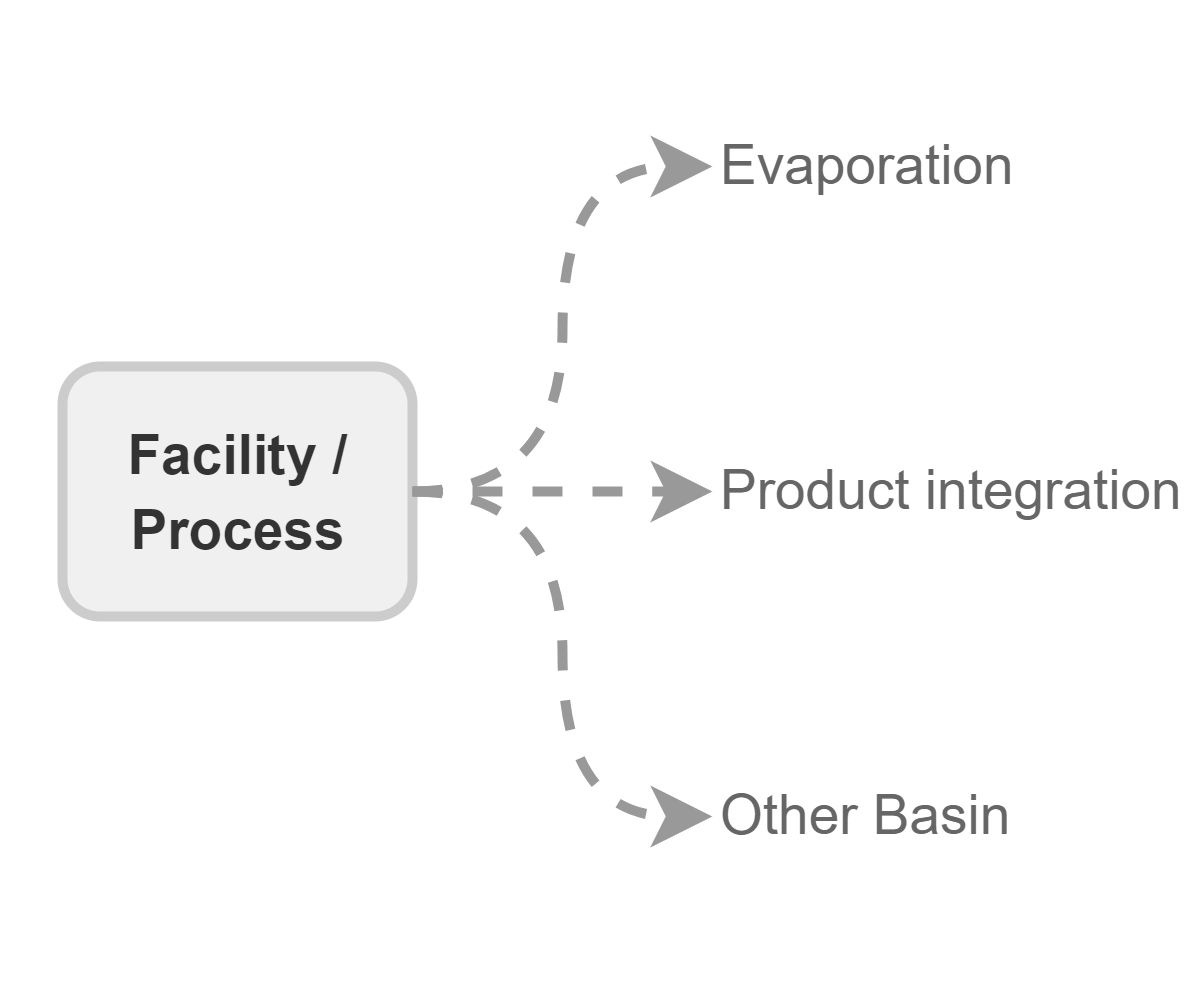
4. Water consumption
Water consumption is the net volume of water withdrawn that is permanently or temporarily lost to the immediate, local ecosystem. Water is classified as consumed if it undergoes one of three fates: it evaporates into the atmosphere, it becomes physically integrated into a commercial product or crop, or it is discharged into a completely separate geographic basin, preventing it from returning to the local source from which it was pulled.
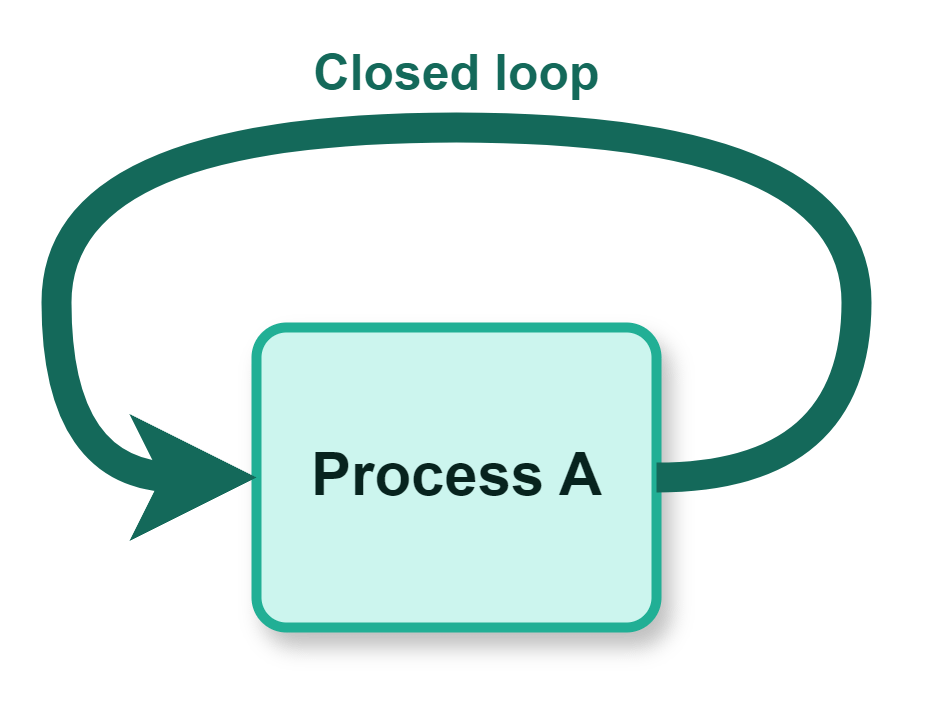
5. Water recycling
Water recycling is the internal practice of capturing wastewater or run-off from a specific operational step, treating it to an appropriate baseline quality standard, and feeding it right back into the exact same operational cycle. This creates a tightly closed loop that directly lowers the facility’s need to make new, external water withdrawals.
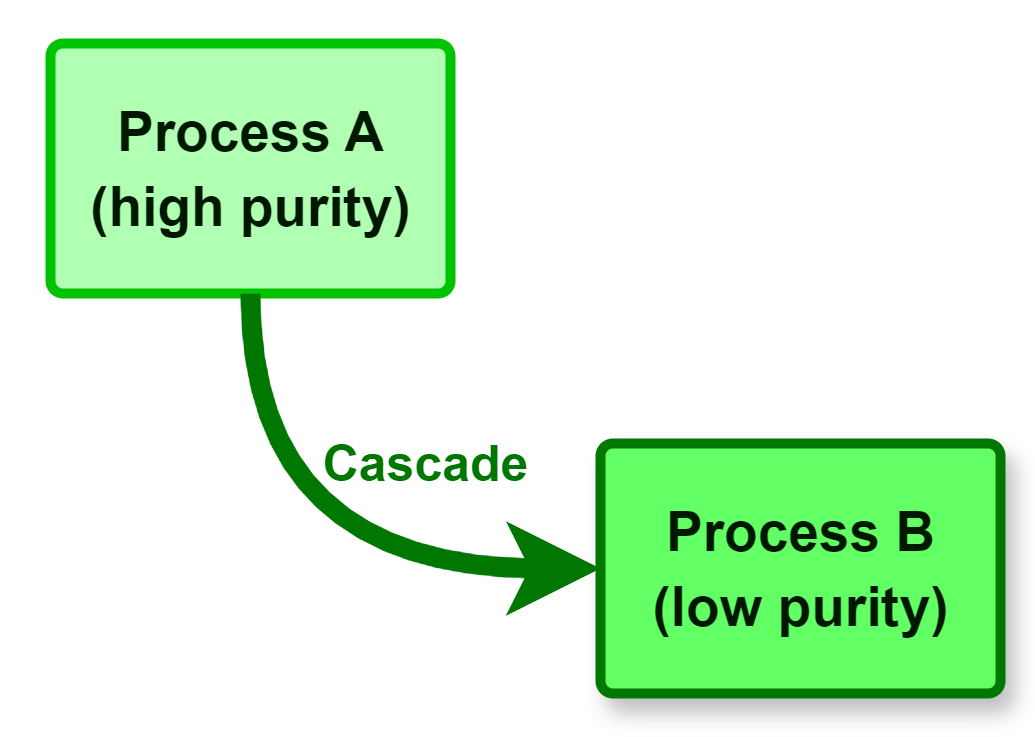
6. Water reuse
Water reuse is the practice of capturing wastewater from one distinct business function, treating it if necessary, and routing it to a completely different process or application within the organization. This represents a cascading system of utility, maximizing efficiency by matching lower-purity wastewater with operational applications that do not require pristine freshwater.
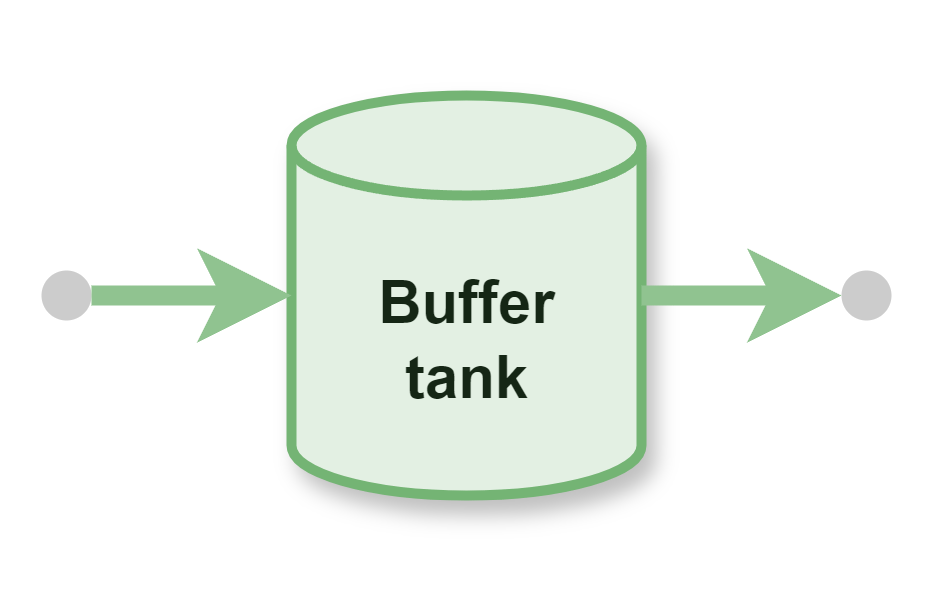
7. Water storage
Water storage is the net volumetric quantity of water held securely on-site within physical, human-made containment boundaries—such as storage tanks, reservoirs, or holding ponds—before its ultimate use, treatment, or discharge. Storage acts as an operational buffer, protecting production continuity against municipal supply disruptions or seasonal scarcity.
3. The operational flow: A day inside the plant
To ground these definitions in real-world corporate strategy, let us walk through a practical case study. Imagine an enterprise-scale beverage processing plant located near a major river basin.
By mapping the facility’s daily data across all seven metrics, we can show how one can use this framework to identify hidden operational risks and measure infrastructure efficiency.
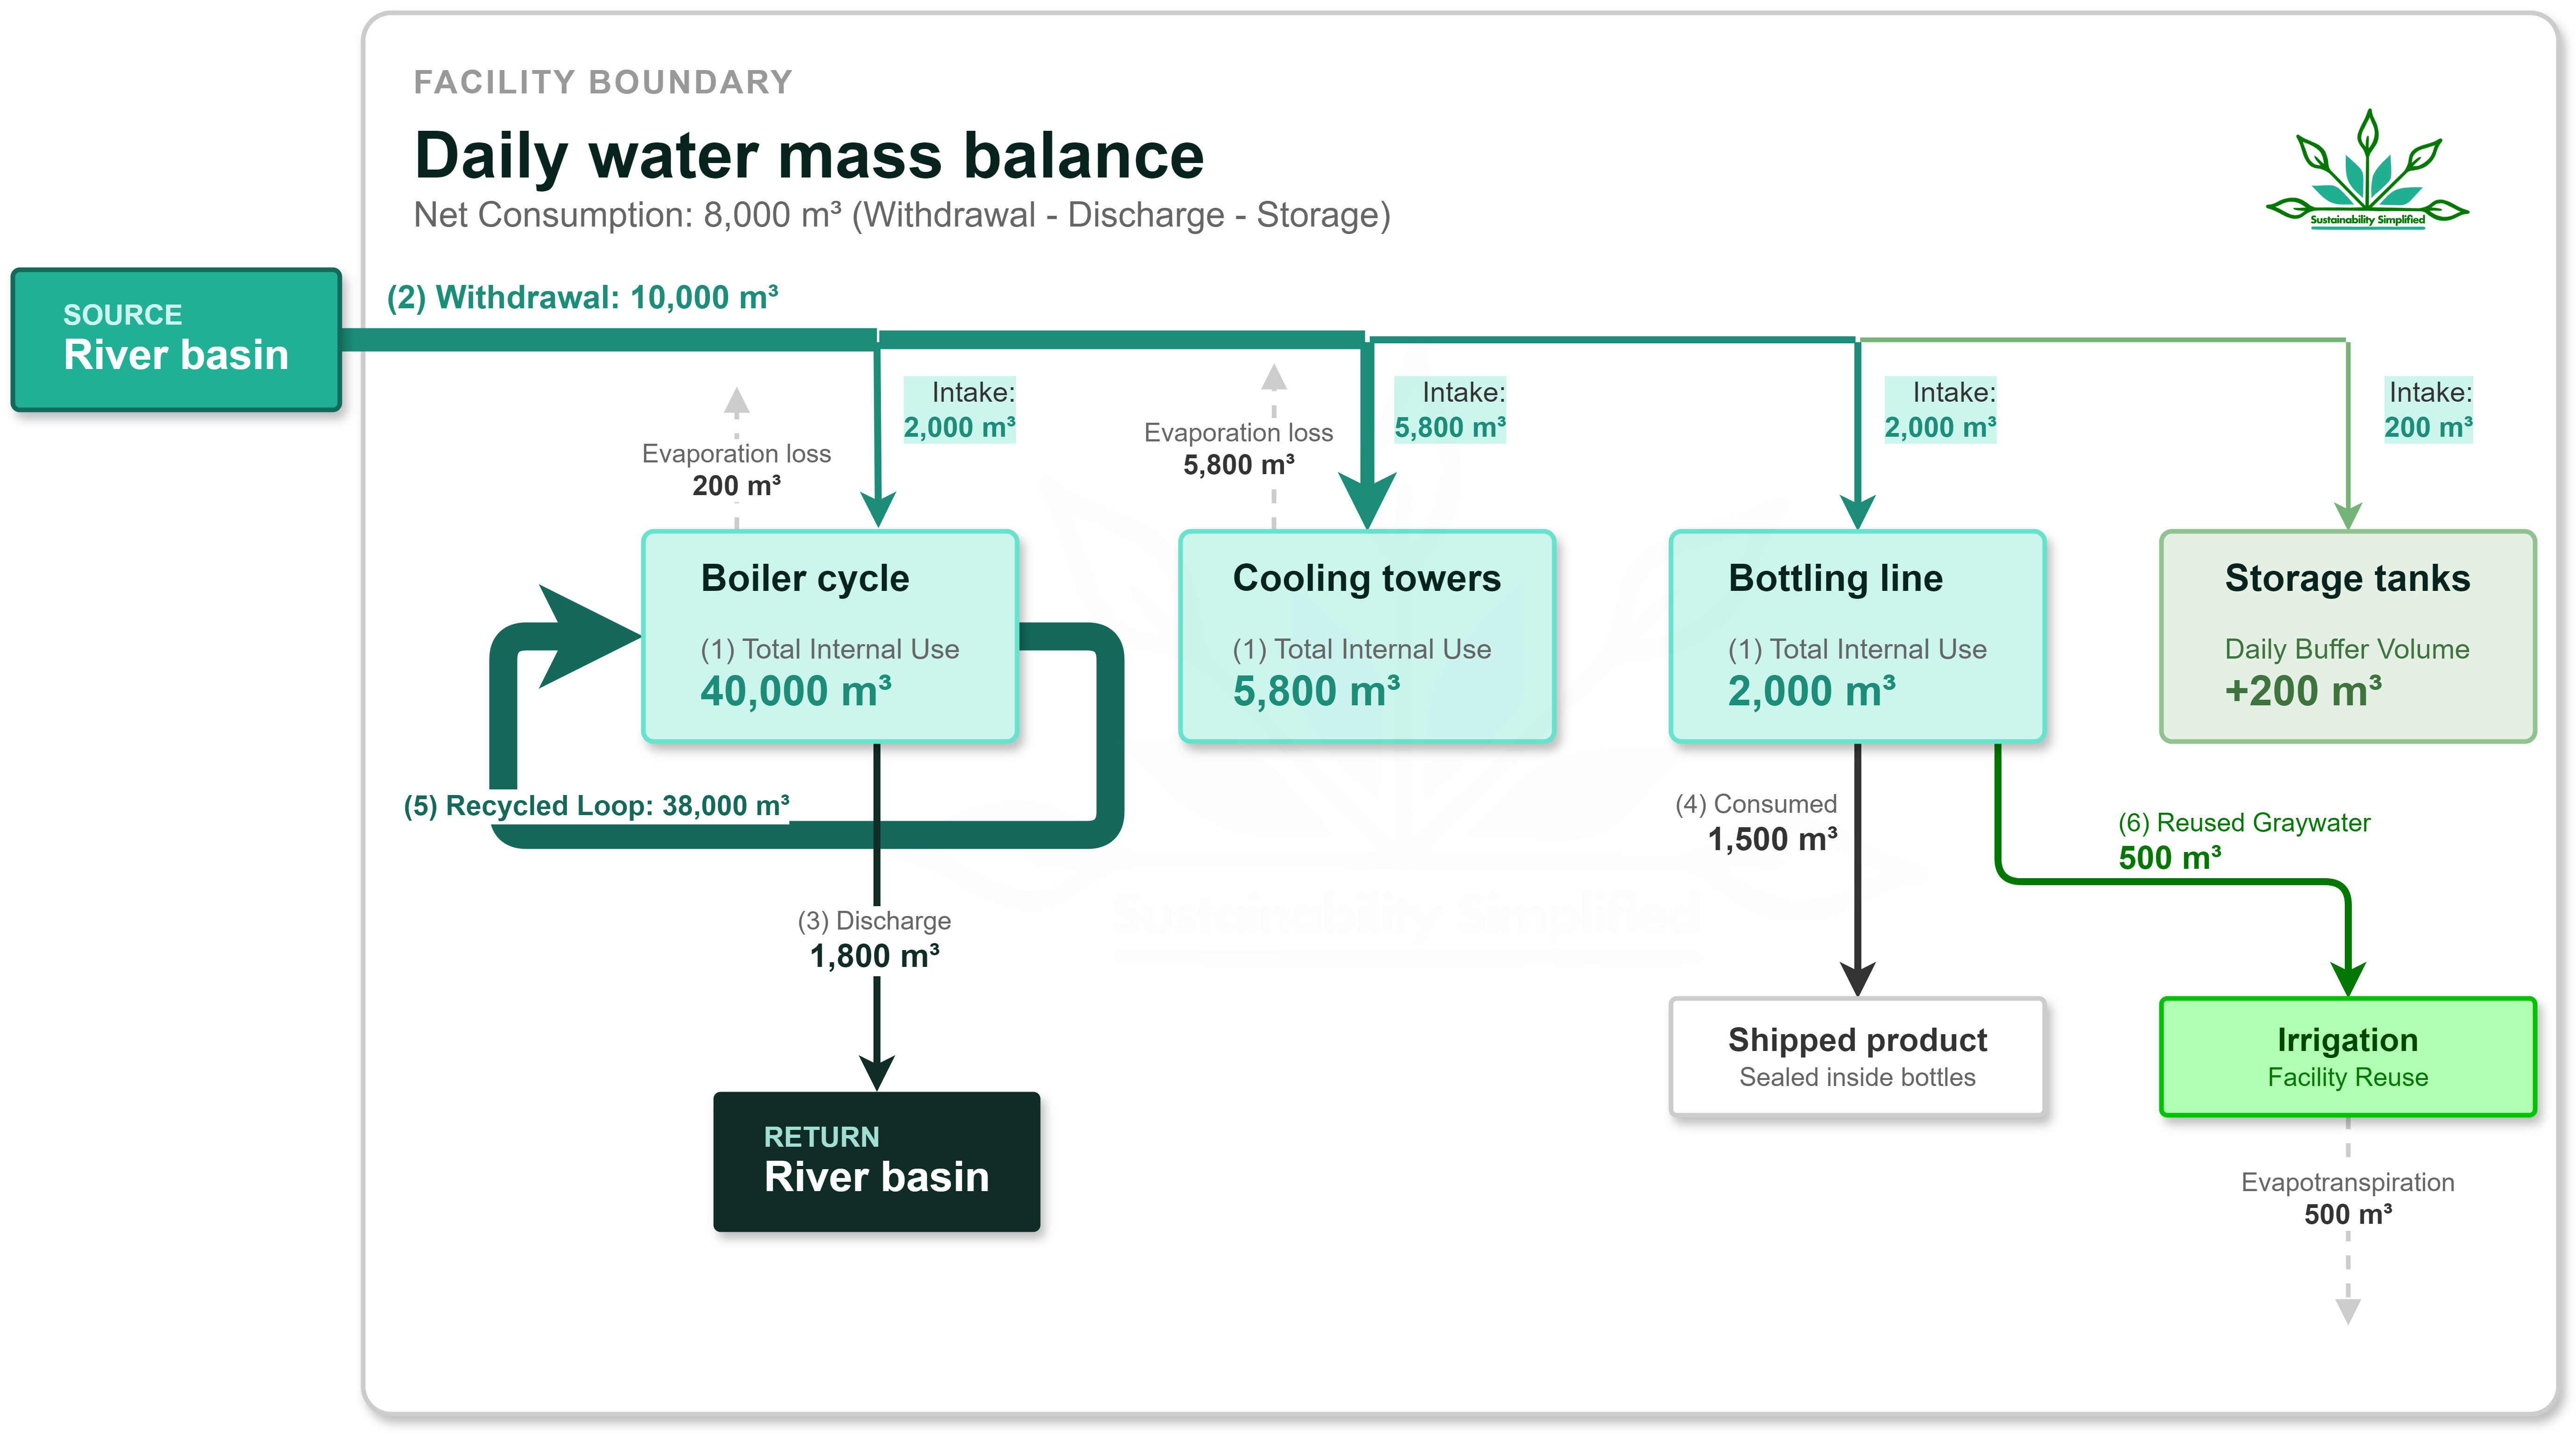
1. Water use in action
The plant operates a massive steam boiler system, cooling towers, a bottling line, and facility landscaping. Over a 24-hour shift, the total volume of water actively circulating through these operations clocks in at 48,300 m³ (combining 40,000 m³ in the boilers, 5,800 m³ in the cooling towers, 2,000 m³ on the bottling line, and 500 m³ routed to landscaping). This is the facility’s water use.
You can use these formulas as well:
The practical application: You can use this number to understand the absolute scale of the plant’s internal operational dependence on water. It tells engineers how much total fluid volume must be pressurized, piped, and treated across internal facility lines to keep the assembly lines moving—regardless of how much water is pulled from the outside environment.
2. Measuring water withdrawal
To keep those operations running, the facility cannot rely solely on what is already inside the building. On this day, the facility pumps 10,000 m³ of freshwater directly from the adjacent river. This is the facility’s water withdrawal.
The practical application: The sustainability team uses this metric to evaluate the plant’s legal compliance and exposure to external environmental risks. If the local government places a drought restriction on the river, or if municipal water tariffs spike, this 10,000 m³ represents the exact point of financial exposure.
3. Tracking water storage buffers
At the start of the day, the facility’s on-site storage tanks are partially empty. Of the water withdrawn from the river, the plant diverts 200 m³ to top off its tanks to protect against potential municipal pressure drops later in the week. This volume represents a positive change in water storage of +200 m³.
The practical application: By isolating this storage buffer, the accounting team ensures that water merely sitting in a tank isn’t accidentally miscategorized as operational waste or environmental loss.
4. Maximizing efficiency via water recycling
If the plant operated on a linear system, it would have run out of water hours ago, since its daily process needs 48,300 m³, vastly exceed what it took from the river which was 10,000 m³.
To bridge this gap, the plant runs a closed-loop recycling system on its steam boilers. It continuously captures hot condensed steam, treats it instantly, and loops 38,000 m³ right back into the same boilers. This is water recycling.
The practical application: This metric directly proves the value of the plant’s infrastructure investments. Without this closed-loop recycling system, the plant would have been forced to withdraw nearly four times more water from the river, drastically increasing its environmental footprint and pumping costs.
5. Implementing circular economy through water reuse
Next, look at the facility’s bottling line. After rinse water is used to clean the outside of beverage bottles, it becomes mildly contaminated with dust and label adhesive. It can no longer be used to clean food-grade machinery.
Instead of draining it, the plant routes 500 m³ of this graywater to an on-site filtration system and pipes it outside for irrigation of the corporate landscaping. This routing is water reuse. Ultimately, this water is lost to the atmosphere via evapotranspiration, making its final fate water consumption.
The practical application: Separating reuse from recycling allows the sustainability director to show the board exactly how the company is executing its circular economy strategy by cascading water down from high-purity processes to lower-purity applications.
6. Quantifying environmental return with water discharge
After accounting for internal loops and storage, the plant safely returns 1,800 m³of fully treated, cooled water back into the river channel. This is the plant’s water discharge.
The practical application: This metric is critical for local environmental compliance. The plant’s engineers must continuously monitor this volume to ensure the discharge meets strict regulatory limits regarding temperature and chemical purity so it does not harm local aquatic life.
7. Calculating net corporate water consumption
Finally, we look at what was permanently lost to the local watershed. During the day, the company fills thousands of bottles with juice, physically sealing 1,500 m³ of water inside products that are shipped away.
At the same time, the facility loses water to the atmosphere across three areas: 5,800 m³ evaporates from the cooling towers, 200 m³ evaporates from the boiler cycle, and 500 m³ is lost to evapotranspiration through the landscaping. Together, this combined loss of 8,000 m³ represents the plant’s absolute water consumption.
Using a fundamental mass-balance formula, the metrics check out perfectly:
The practical application: This final figure is what the C-suite reports to investors and watershed managers. It shows the net volumetric depletion the company caused to that specific local ecosystem over a single operational day.
4. High-level summary for ESG dashboards
When presenting these numbers side by side, sustainability professionals face a challenge: how to make complex volumetric engineering data instantly scannable for C-suite executives.
To overcome this challenge, you can use the Corporate Water Footprint Snapshot Tool built entirely inside standard Excel. It takes these exact case-study inputs and automatically visualizes the entire system balance.
You put your data into this sheet:
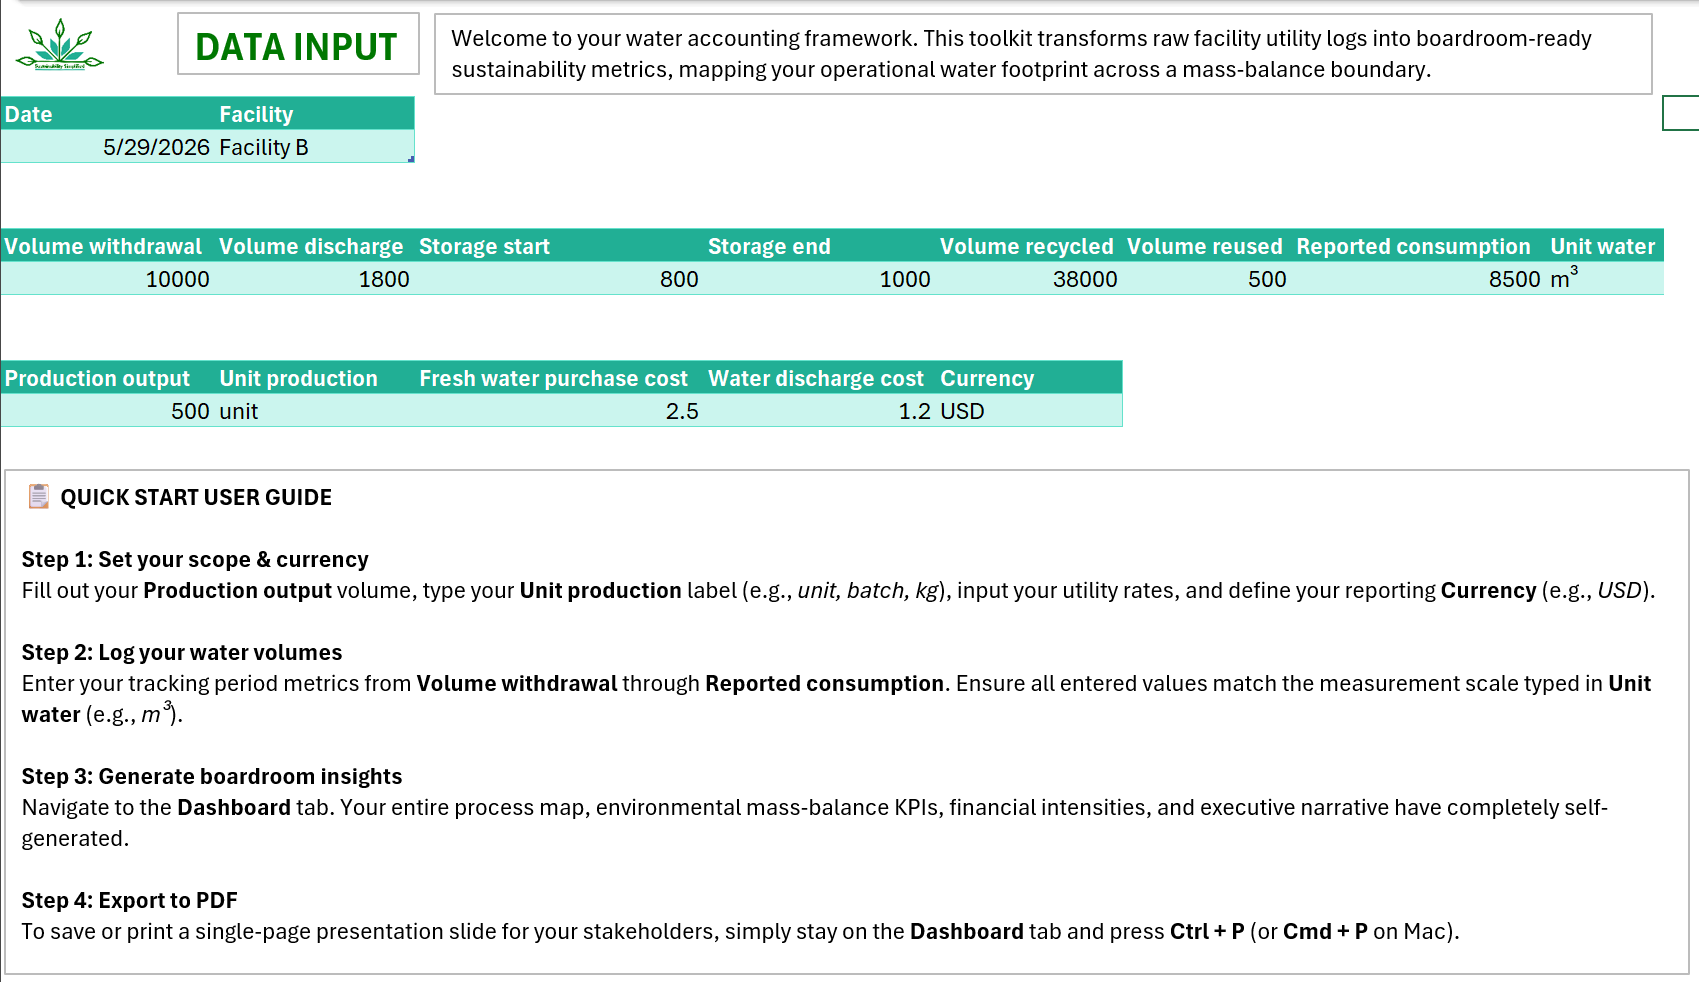
Which gets automatically translated into this printable dashboard:
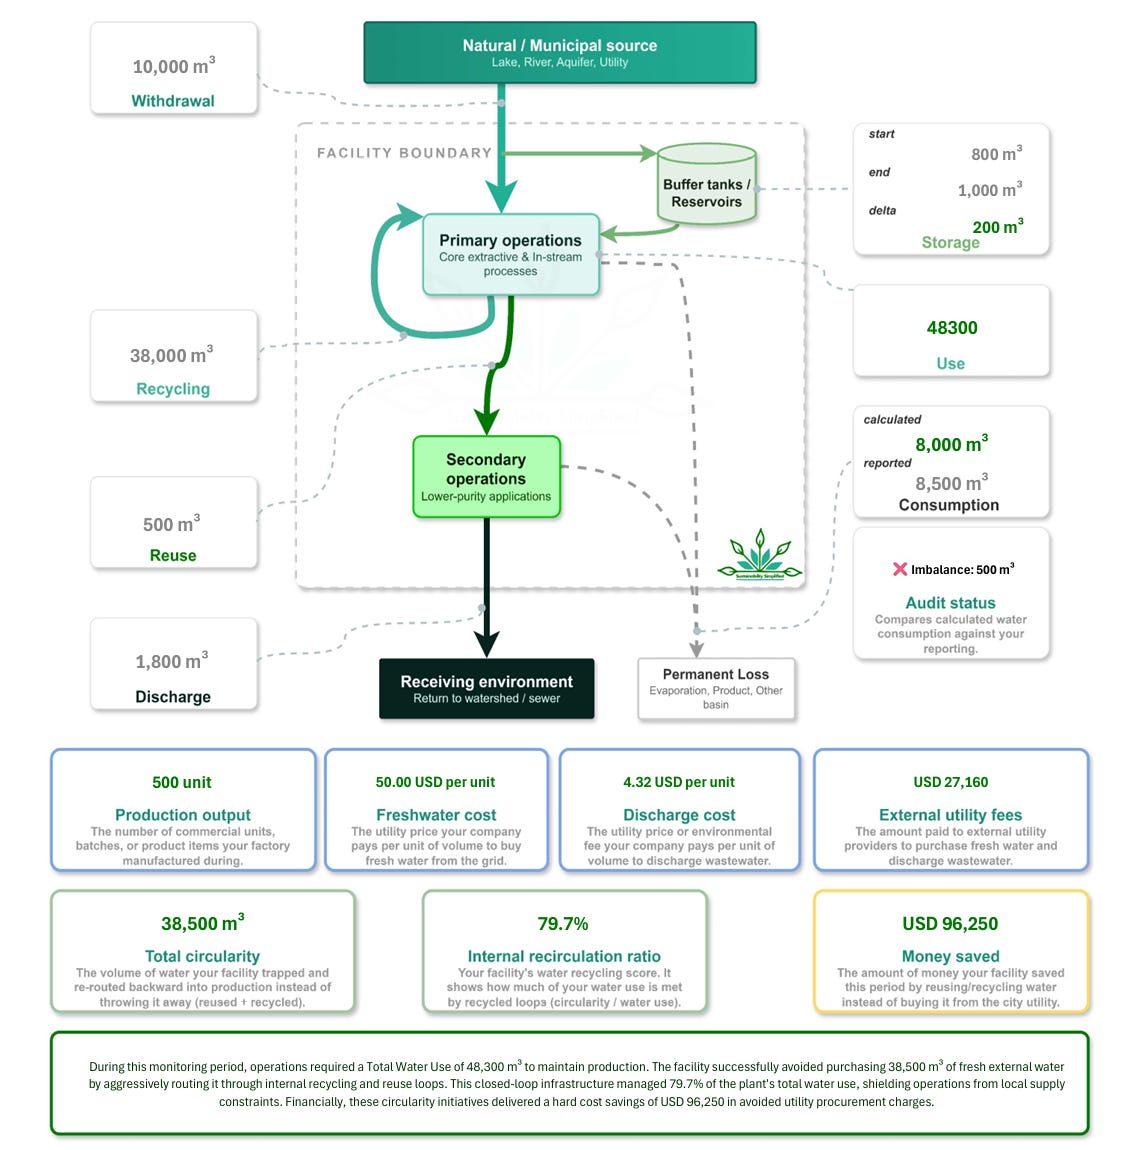
Think of this toolkit as a quick scan or a high-impact snapshot of your water numbers. It is built to give you a fast, clear overview of your operations right now.
Best used for: Quickly checking a single facility’s or company’s current water balance, finding out your recycling/reuse scores, and spotting immediate financial risks or savings opportunities. It is perfect for consultants, plant managers, and sustainability teams who need an instant baseline.
What it is NOT: This is a static, single-period assessment tool. It is not a giant, multi-year database, a historical tracker, or a forecasting tool.
Tip for long-term tracking: If you want to use this to track performance over time, simply save a brand-new copy of this file for each individual reporting period (e.g., Corporate Water Footprint Snapshot Tool_Q1_26.xlsx, Corporate Water Footprint Snapshot Tool_Q2_26.xlsx).
📥 Download the Corporate Water Footprint Snapshot Tool
Mastering these seven metrics can help you provide valuable insights into your environmental impact and how to manage resources in both low-risk and high-risk areas.
Further, transparency helps track progress toward broader corporate sustainability goals and allows stakeholders to hold organizations accountable for their impact.