Circularity: Setting up your own circularity indicators (2/3)
How do you set up indicators to measure progress towards becoming more circular? What are common pitfalls?

1. Introduction
In thelast article, we explored the R-ladder framework and how it shapes circular economy goals. Let’s tackle the next step: selecting indicators that turn abstract circularity ambitions into measurable progress.
Why does this matter? Without the right metrics, businesses risk:
Greenwashing: Celebrating vague "sustainability efforts" with no real impact
Analysis paralysis: Drowning in irrelevant data while missing key insights
Missed opportunities: Overlooking cost savings, customer loyalty, and regulatory advantages
This article will guide you through a process to define your scope, choose KPIs that drive actionable circular strategies, and common mistakes when selecting indicators. Let’s dive in.
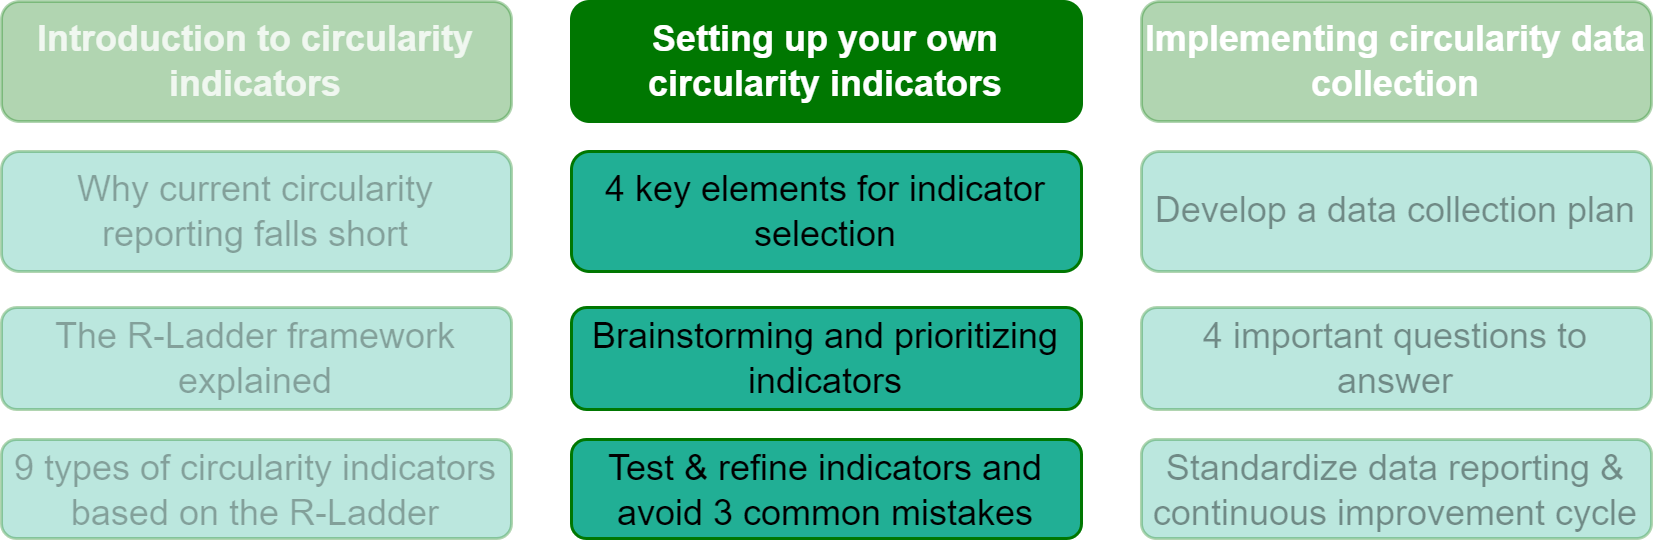
You are reading part 2 of this series:
2. Define the scope for indicator selection
The pitfall: Companies often track "standard" sustainability metrics (like recycling rates) that don’t reflect their unique circular strategy. A fast-fashion brand and an EV battery manufacturer need entirely different KPIs.
Instead, businesses need to have a clear understanding of what they are measuring. Without a defined scope, companies risk tracking the wrong metrics, leading to misleading results or wasted effort.
To define the scope, businesses should consider four important elements:
1️⃣ Your core circular strategy
Ask yourself: Which rung of the R-ladder are we prioritizing?
Reuse (e.g., IKEA’s furniture buyback program)
Remanufacturing (e.g., Caterpillar’s rebuilt parts business)
Product-as-a-Service (e.g., Philips’ "Light as a Service" leases)
Example: Patagonia’s Worn Wear program focuses on resale/repair. Their KPIs track % of revenue from refurbished goods and average garment lifespan—not just recycling volumes.
Read more about the R-ladder here:

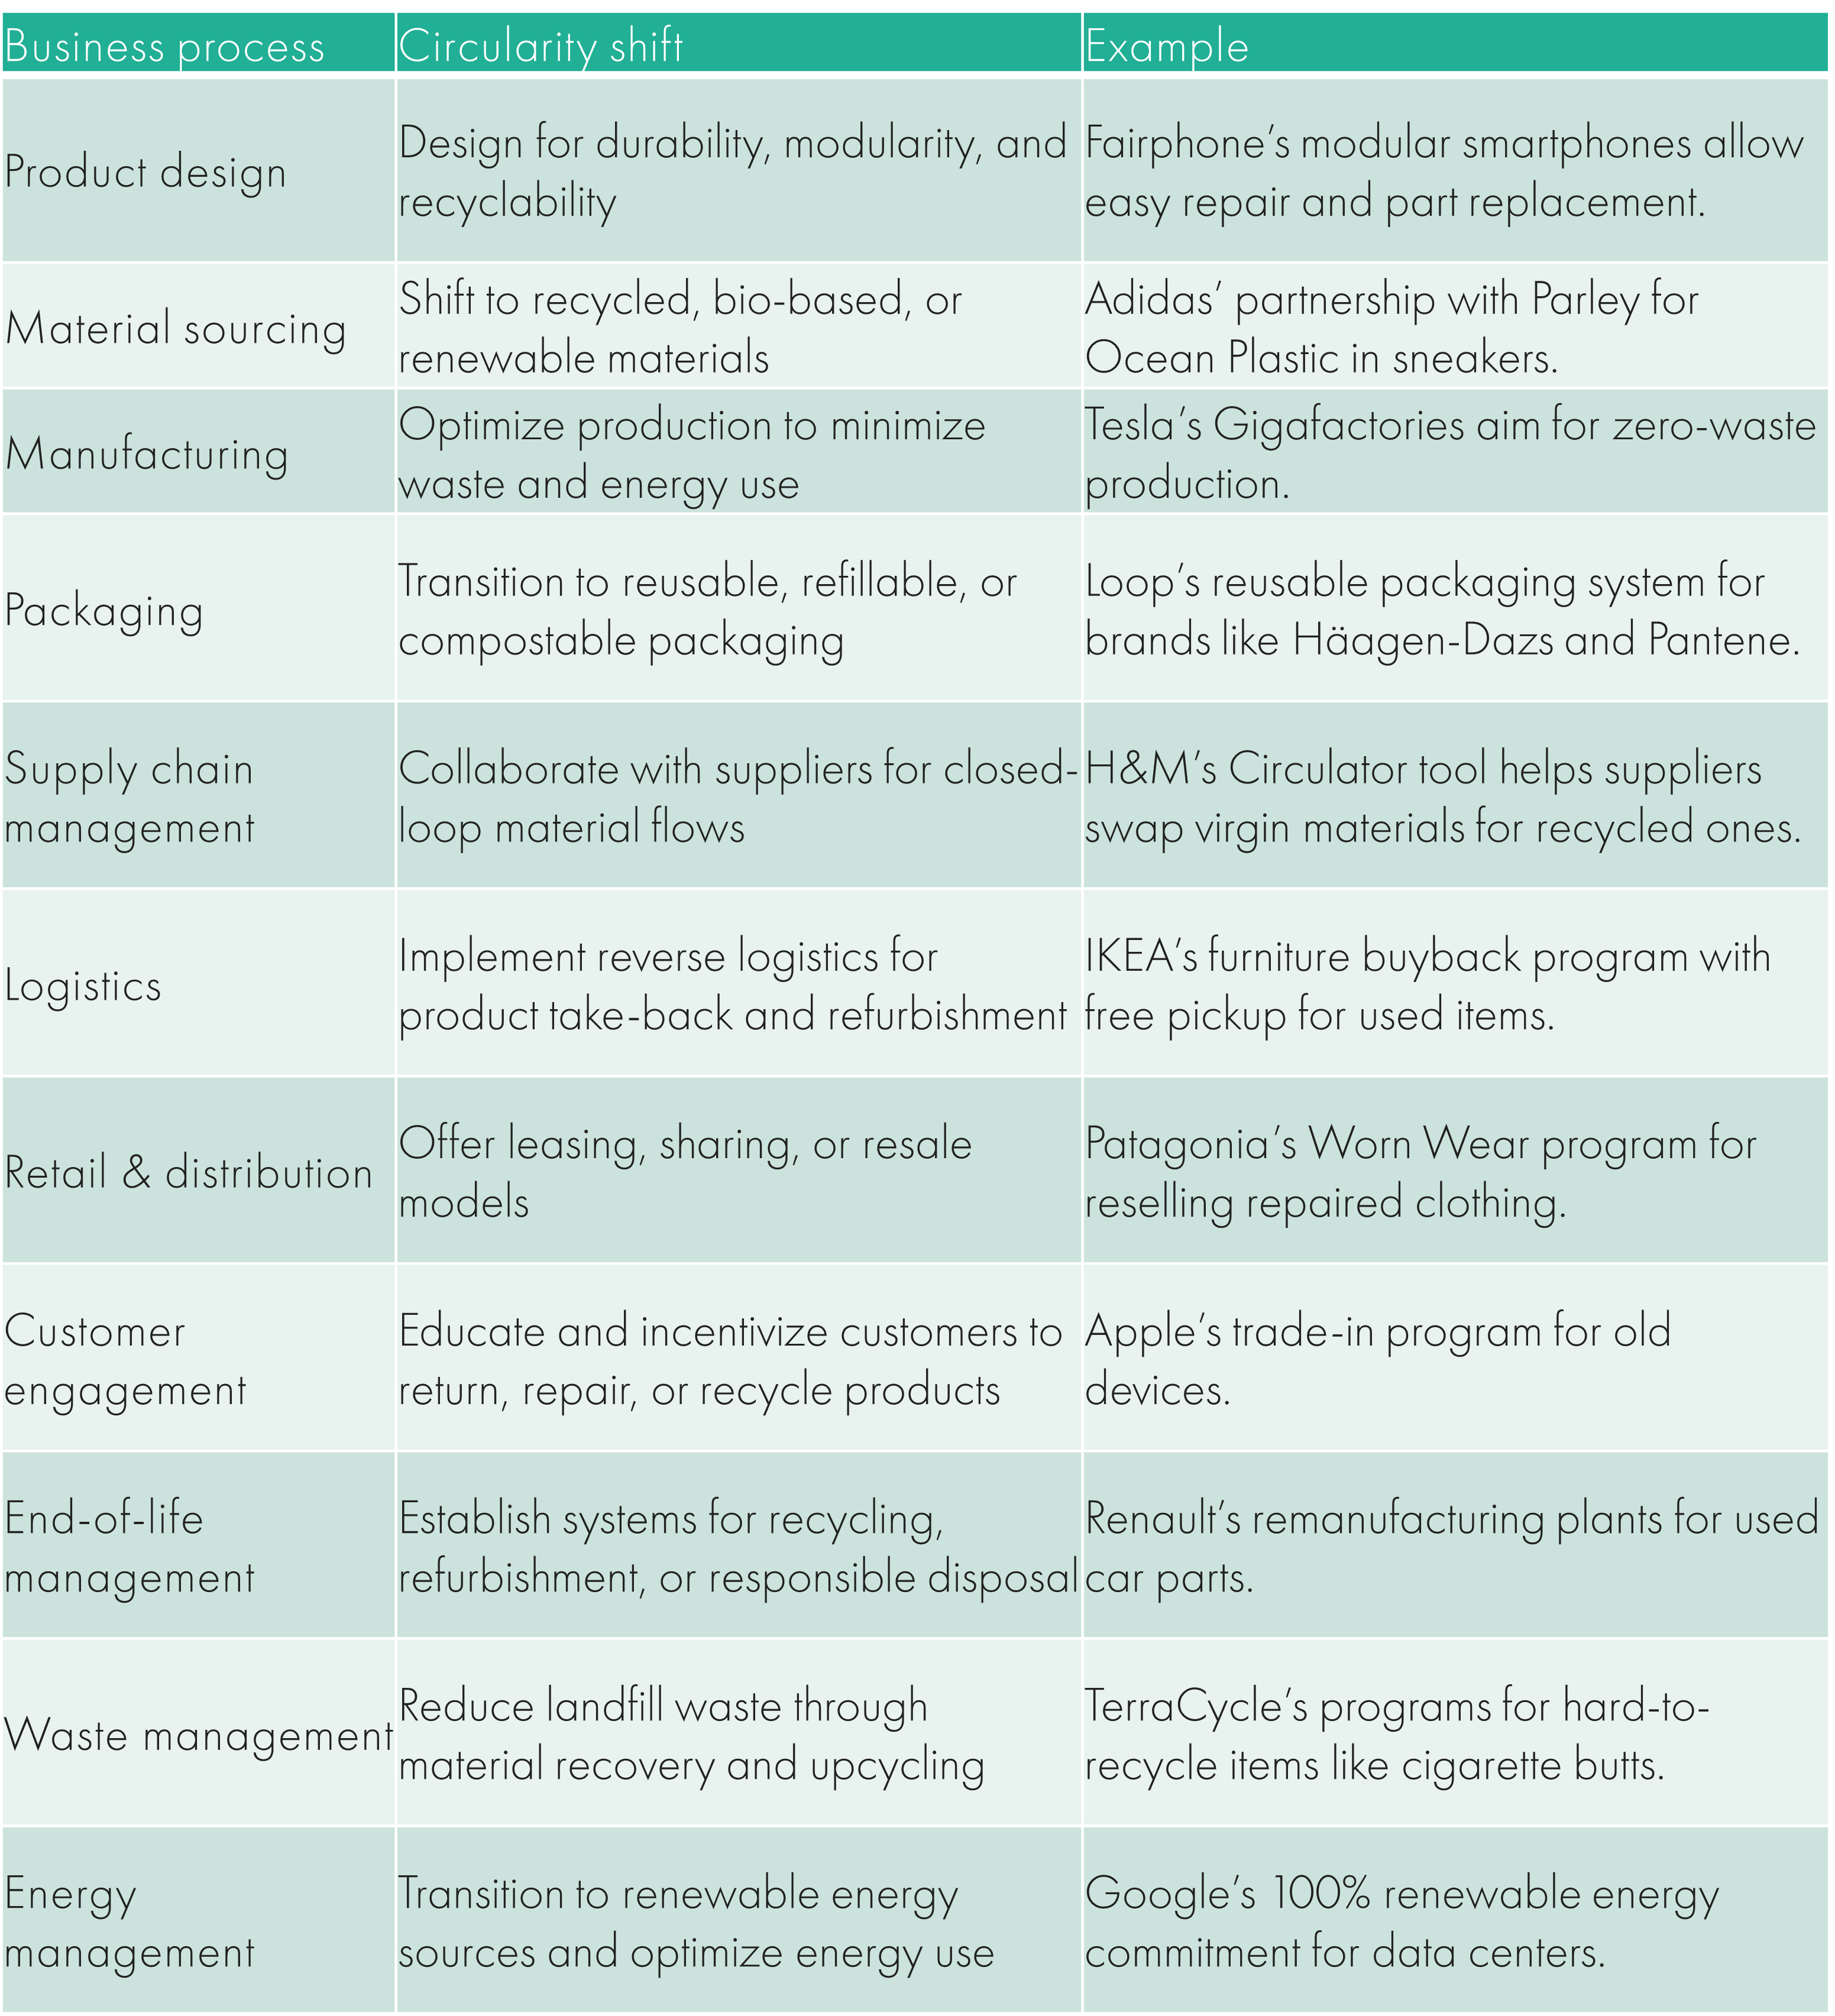
2️⃣ Impacted business processes
Map where circularity reshapes your operations: